The media landscape was upended more than a decade ago when the video-sharing site YouTube was launched. The volume and variety of content posted on the site is staggering. The site’s popularity makes it a launchpad for performers, businesses and commentators on every conceivable subject. And like many platforms in the modern digital ecosystem, YouTube has in recent years become a flashpoint in ongoing debates over issues such as online harassment, misinformation and the impact of technology on children.
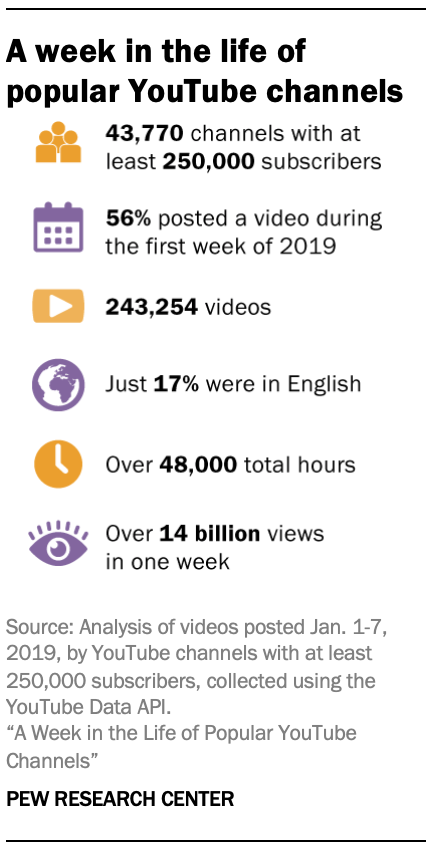
Amid this growing focus, and in an effort to continue demystifying the content of this popular source of information, Pew Research Center used its own custom mapping technique to assemble a list of popular YouTube channels (those with at least 250,000 subscribers) that existed as of late 2018, then conducted a large-scale analysis of the videos those channels produced in the first week of 2019. The Center identified a total of 43,770 of these high-subscriber channels using a process similar to the one used in our study of the YouTube recommendation algorithm. This data collection produced a variety of insights into the nature of content on the platform:
The YouTube ecosystem produces a vast quantity of content. These popular channels alone posted nearly a quarter-million videos in the first seven days of 2019, totaling 48,486 hours of content. To put this figure in context, a single person watching videos for eight hours a day (with no breaks or days off) would need more than 16 years to watch all the content posted by just the most popular channels on the platform during a single week. The average video posted by these channels during this time period was roughly 12 minutes long and received 58,358 views during its first week on the site.
Altogether, these videos were viewed over 14.2 billion times in their first seven days on the platform.1
YouTube is a global phenomenon, and its most popular channels posted a substantial amount of content in languages other than English. Using a combination of hand-labeling and machine learning, the Center categorized videos based on whether or not they contained any text or audio in a language other than English. The results of this analysis illustrate the global nature of the YouTube platform. Just over half of these channels (56%) posted a video during the first week of 2019, and the majority of these active channels (72%) posted at least one video that was partially or completely in a language other than English. Overall, just 17% of the nearly quarter-million videos included in this analysis were fully in English.
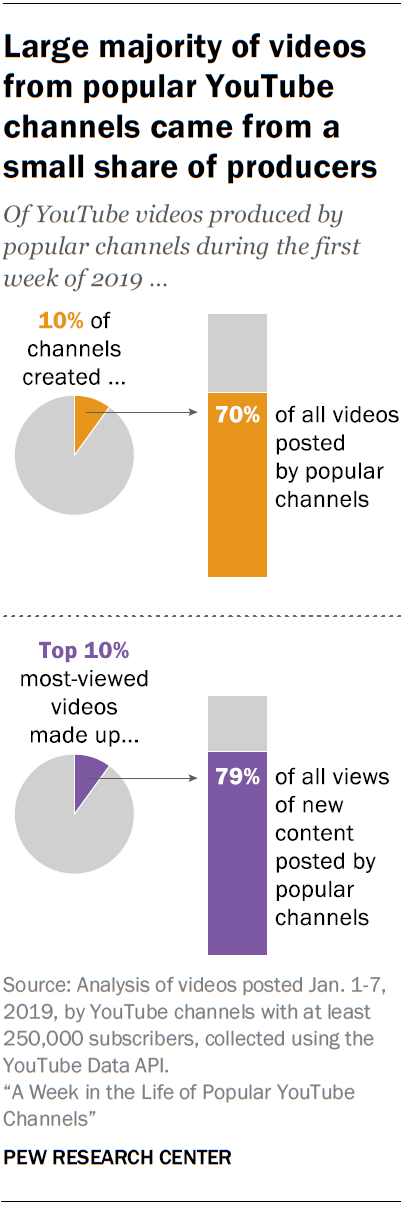
A small share of highly active creators produced a majority of the content posted by these popular channels. As is the case with many online platforms (such as Twitter) a relatively small share of channels were responsible for a majority of the content posted during the study period. Just 10% of the popular channels identified in the Center’s mapping produced 70% of all the videos posted by these channels during the first week of 2019. Similarly, the 10% of popular-channel videos that had the most views in this period were responsible for 79% of all the views that went to new content posted by these channels.
The total number of high-subscriber channels increased dramatically in the second half of 2018. The Center’s mapping process identified 9,689 channels that crossed the 250,000-subscriber threshold between July 2018, when the Center last conducted an analysis of YouTube data, and December 2018, when the data was updated for this analysis. That represents a 32% increase in the total number of popular channels over that period. By the same token, the number of subscribers to existing popular channels that had already been identified as of July 2018 increased by an average of 27% over the same period.
In addition to this broader data collection, Pew Research Center also conducted a separate content analysis of the English-language videos posted by these popular channels over the first week of 2019 (in total, 37,079 videos met this description). The Center used human coders to identify the primary category or theme of each video (such as video games, consumer technology or current events and politics), and also examined the keywords used in video titles and descriptions to identify words that were widely used and associated with higher view counts relative to other videos. Some of the key findings from this analysis include:
Videos aimed at children were highly popular, as were those that featured children under the age of 13 – regardless of their intended audience. Only a small share of English-language videos posted by these popular channels during the study period were explicitly intended for children (based on a consensus of human coders). But those that were tended to be longer, received more views, and came from channels with a larger number of subscribers relative to general-audience videos. More broadly, videos featuring a child or children who appeared to be under the age of 13 – regardless of whether the video in question was aimed exclusively at children or not – received nearly three times as many views on average as other types of videos. And the very small subset of videos that were directly aimed at a young audience and also featured a child under the age of 13 were more popular than any other type of content identified in this analysis as measured by view counts.
It should be noted that YouTube explicitly states that the platform is not intended for children under the age of 13. YouTube provides a YouTube Kids platform with enhanced parental controls and curated video playlists, but the analysis in this report focuses on YouTube as a whole.
English-language videos related to current events or politics posted by these popular channels tended to have an international (rather than U.S.) focus. Videos explicitly related to current events or politics were relatively common, comprising 16% of all English-language videos uploaded during the study period. However, the majority of these videos were international in focus and did not mention events, issues or opinions related to the United States. While channels that posted one or more U.S. current events or politics videos were particularly active – posting an average of 63 total videos during the week – U.S. current events or politics videos comprised just 4% of all of the videos that were posted by popular channels overall.
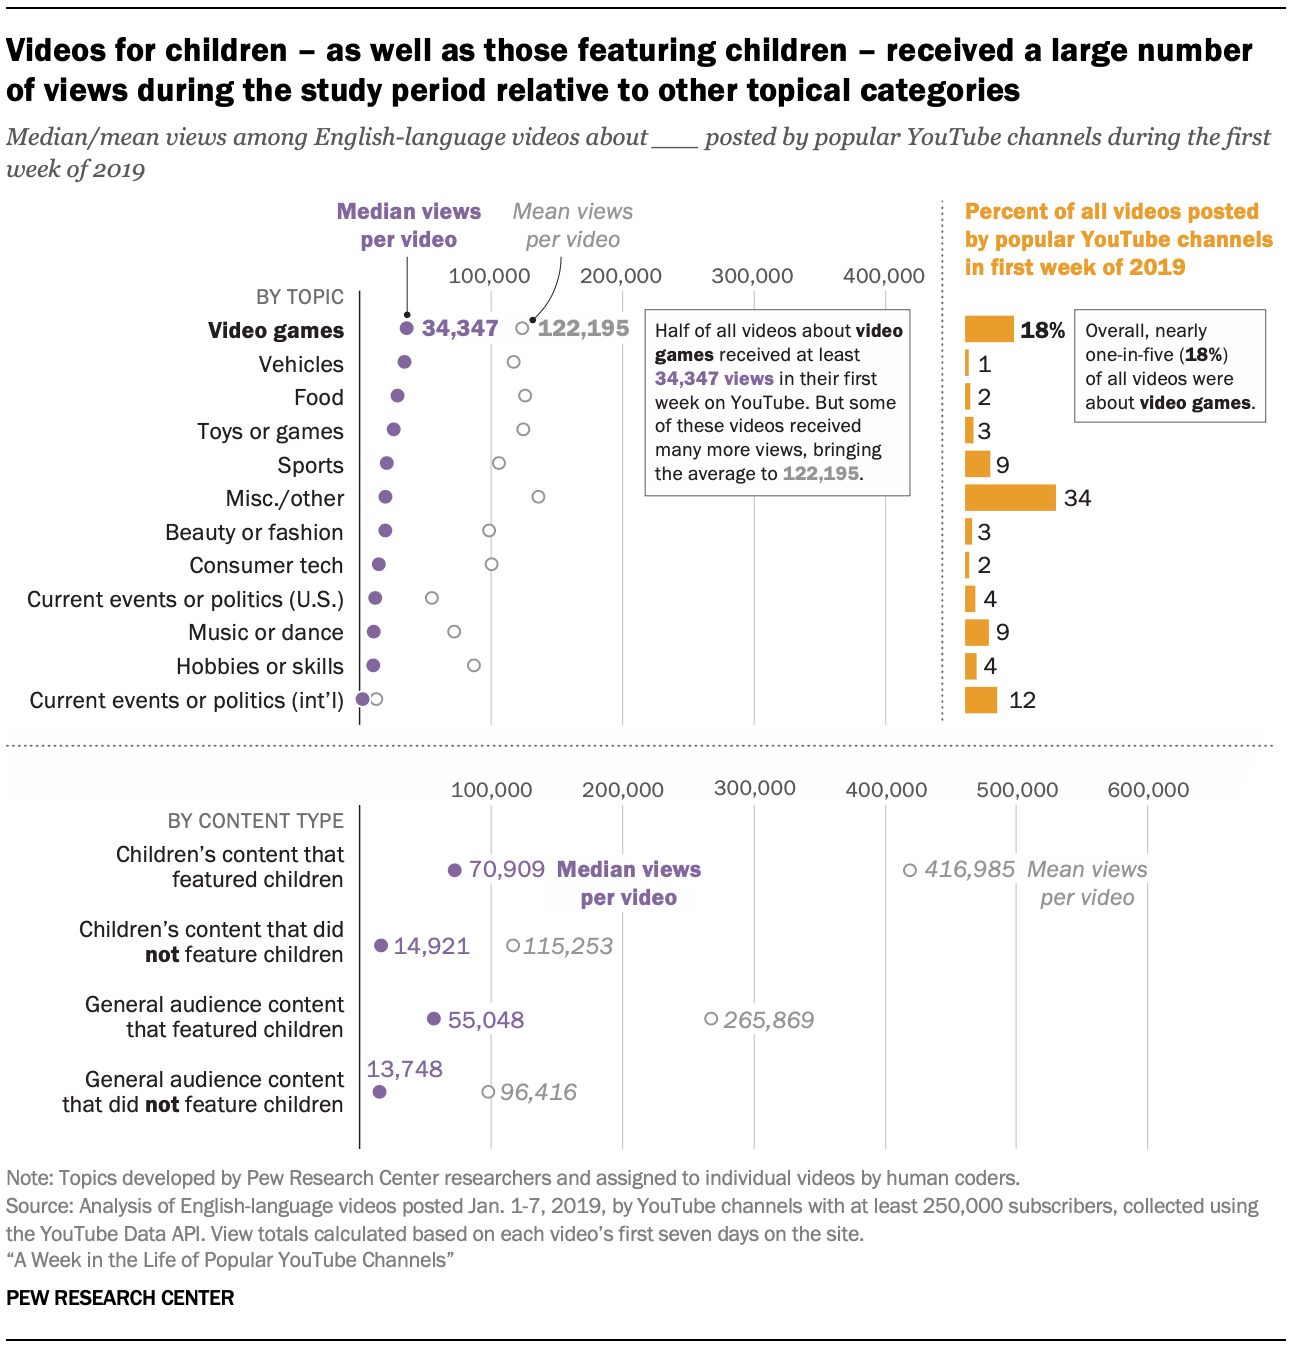
Content involving video games was a fixture of popular channels on YouTube. Meanwhile, some 18% of English-language videos posted by popular channels during the study period related to video games or gaming. Content about video games was one of the most popular genres of content as measured by total views during the seven days of the study period, and these videos also tended to be much longer than other types of videos.
Certain video title keywords were associated with increased view counts. An analysis of the titles of English-language videos finds that certain keywords were associated with much higher view counts relative to other videos over the course of the study period. Some of these point to the platform’s orientation toward entertainment. For instance, videos mentioning words like “Fortnite,” “prank” or “worst” received more than five times as many views at the median as videos not mentioning those words. Others were more substantive in nature. For example, the use of the word “Trump” in video titles was associated with a significant increase in median views among videos about American current events or politics. Indeed, some 36% of videos about American current events or politics posted by these popular channels during the study period mentioned the words “president” or “Trump” in their titles.
Cross-promotion of videos with other social media channels was both widespread and associated with an increase in views. Seven-in-ten of these videos mentioned other prominent social media platforms such as Instagram or Twitter in their description (either in links or in the text itself), and those that did received more views than videos that did not link to other platforms.
The above findings are based on an analysis of YouTube channels with at least 250,000 subscribers and the videos they posted over the week of Jan. 1-7, 2019, building on the Center’s previous study of the YouTube recommendation algorithm. Using several recursive and randomized methods, we traversed millions of video recommendations made available through the YouTube API and identified as many unique channels as possible. As of January 2019, 1,525,690 total channels had been found, 43,770 of which had at least 250,000 subscribers. For the purposes of this study, these are defined as “popular channels.” Using this list of popular channels, researchers collected every video published on these channels during the first week of 2019 and tracked each of them for the seven days following their publication.
In the same way that survey research involves a certain degree of uncertainty and error, “big data” projects are also subject to potential error as well. While Pew Research Center made every attempt to conduct this analysis with rigor and accuracy, there are several different ways a modest amount of error may have been introduced. The findings presented here should be considered with this potential for error in mind.
- Definition of popular channels. The Center chose a minimum threshold of 250,000 subscribers for the channels included in this analysis. This cutoff ensured that the analysis was focused on the most popular channels on the site while also limiting the analysis to a manageable number of channels that could be monitored and tracked in a timely manner. However, it is possible that the use of a lower (or higher) threshold and the inclusion of more (or fewer) channels would have yielded different results.
- Missing popular channels. Because there is no official, comprehensive list of YouTube channels (popular or otherwise), the Center used its own mapping technique to search for and identify channels. This process involved repeatedly following video recommendations from one channel to another for nearly a year until we could no longer identify any additional channels with more than 250,000 subscribers. It is possible that this process failed to identify all the popular channels on YouTube, but evidence suggests that the number of missing channels is likely to be negligible. During the final six months of channel mapping between July and December 2018, the list of popular channels that we had identified expanded by 44% – from 30,481 channels to 43,770. However, the bulk of these additions comprised known channels that had added new subscribers during that period. Just 12% of the new channels had not been previously identified by our mapping process.
- Problems with the YouTube API. During the data collection process, requests to the YouTube Application Programming Interface (API) occasionally failed for a variety of reasons. As a result, we were unable to capture 4% of the video time stamps we had intended to collect. Such hiccups are not uncommon when working with APIs, and can be due to bugs, issues with internet connectivity, changes to privacy settings made by channel owners, or simply because some videos were removed during the week. Because these errors were sporadic and appeared to occur at random, the Center was able to use estimation methods to fill in most of the missing values. While this introduced a small amount of approximation error, its impact on the findings presented here should be negligible.
- Language misclassification. Because it was unrealistic for humans to directly examine the nearly quarter-million videos posted by these channels, the Center trained a custom machine learning model to automate the process of classifying whether or not a video was in English. When compared with a sample of videos that had been coded by Center researchers, the classification model achieved 97% to 98% accuracy during various tests. However, 4% to 9% of the videos that it labeled as “English” contained content in other languages, and the model also misclassified 7% to 8% of the videos that human coders had identified as being in English. Videos that were incorrectly labeled as English by the model were later removed by human coders during content analysis, but it is likely that a small set of English videos were excluded from the analysis due to classification error.
- Coder misclassification. Pew Research Center used human coders to classify the content of the English-language videos examined in this study. Center researchers labeled a small sample of videos themselves, while the remaining thousands were each coded by three separate coders on Amazon’s Mechanical Turk crowdsourcing platform. For each video, we then reconciled the results from the three coders using thresholds that maximized how much the crowdsourced results agreed with the Center’s researchers. While agreement was generally high, a modest number of disagreements and misclassifications are still likely to have occurred because the concepts studied here – such what qualifies as “children’s content” – inherently involve a certain degree of subjectivity.
- YouTube is constantly changing. The videos analyzed in this report represent those posted by channels with a certain number of subscribers over a particular period of time. Since then, many channels may have gained or lost subscribers, the publishing habits of popular channels may have changed, and the viewing habits of their subscribers may have as well. YouTube has also since made changes to its policies about the kinds of content that are acceptable to publish. Because of these and many other constantly shifting factors, the findings presented here may or may not represent the activity of popular channels at other times in the past, present or future.


