The PSRAI December 2014 Omnibus Weeks 1 & 3 obtained telephone interviews with a nationally representative sample of 2,002 adults living in the continental United States. Telephone interviews were conducted by landline (1,001) and cell phone (1,001, including 605 without a landline phone). The survey was conducted by Princeton Survey Research Associates International (PSRAI). Interviews were done in English and Spanish by Princeton Data Source from December 4-7, 2014 (1,001) and from December 18-21, 2014 (1,001). Statistical results are weighted to correct known demographic discrepancies. The margin of sampling error for the complete set of weighted data is ± 2.5 percentage points.
December Omnibus Week 1 and December Omnibus Week 3 were run as separate studies. The sample for each survey was weighted independently, not as a combined sample, although both studies used the same sample design, contact procedures, weighting procedures and weighting parameters. Details on the design, execution and analysis of the surveys are discussed below.
Sample Design
For each survey, a combination of landline and cellular random digit dial (RDD) samples was used to represent all adults in the continental United States who have access to either a landline or cellular telephone. Both samples were provided by Survey Sampling International, LLC (SSI) according to PSRAI specifications.
Numbers for the landline sample were drawn with equal probabilities from active blocks (area code + exchange + two-digit block number) that contained three or more residential directory listings. The cellular sample was not list-assisted, but was drawn through a systematic sampling from dedicated wireless 100-blocks and shared service 100-blocks with no directory-listed landline numbers.
Contact Procedures
December Week 1 interviews were conducted December 4 to 7, 2014 and December Week 3 interviews were conducted December 18 to 21, 2014. As many as three attempts were made to contact every sampled telephone number. For each study, sample was released for interviewing in replicates, which are representative subsamples of the larger sample. Using replicates to control the release of sample ensures that complete call procedures are followed for the entire sample. Calls were staggered over times of day and days of the week to maximize the chance of making contact with potential respondents. Each phone number received at least one daytime call when necessary.
For the landline sample, interviewers asked to speak with the youngest adult male or female currently at home based on a random rotation. If no male/female was available, interviewers asked to speak with the youngest adult of the other gender. This systematic respondent selection technique has been shown to produce samples that closely mirror the population in terms of age and gender when combined with cell interviewing.
For the cellular sample, interviews were conducted with the person who answered the phone. Interviewers verified that the person was an adult and in a safe place before administering the survey.
Weighting and Analysis
Because the studies were run at separate periods, the sample for each wave was weighted separately and not as one combined study. The weighting procedures detailed below were used for both surveys.
Weighting is generally used in survey analysis to compensate for sample designs and patterns of non-response that might bias results. The sample was weighted to match national adult general population parameters. A two-stage weighting procedure was used to weight the dual-frame sample.
The first stage of weighting corrected for different probabilities of selection associated with the number of adults in each household and each respondent’s telephone usage patterns. This weighting also adjusts for the overlapping landline and cell sample frames and the relative sizes of each frame and each sample.
The second stage of weighting balanced sample demographics to population parameters. The sample is balanced to match national population parameters for sex, age, education, race, Hispanic origin, region (U.S. Census definitions), population density, and telephone usage. The basic weighting parameters came from the US Census Bureau’s 2012 American Community Survey data. The population density parameter was derived from Census 2010 data. The telephone usage parameter came from an analysis of the July-December 2013 National Health Interview Survey.
Weighting was accomplished using the SPSSINC RAKE, an SPSS extension module that simultaneously balances the distributions of all variables using the GENLOG procedure. Weights were trimmed to prevent individual interviews from having too much influence on the final results. The use of these weights in statistical analysis ensures that the demographic characteristics of the sample closely approximate the demographic characteristics of the national population.
Post-data collection statistical adjustments require analysis procedures that reflect departures from simple random sampling. PSRAI calculates the effects of these design features so that an appropriate adjustment can be incorporated into tests of statistical significance when using these data. The so-called “design effect” or deff represents the loss in statistical efficiency that results from unequal weights. The combined total design effect for both surveys is 1.31.
The margins of error reported and statistical tests of significance are adjusted to account for the survey’s design effect, a measure of how much efficiency is lost from the weighting procedures.
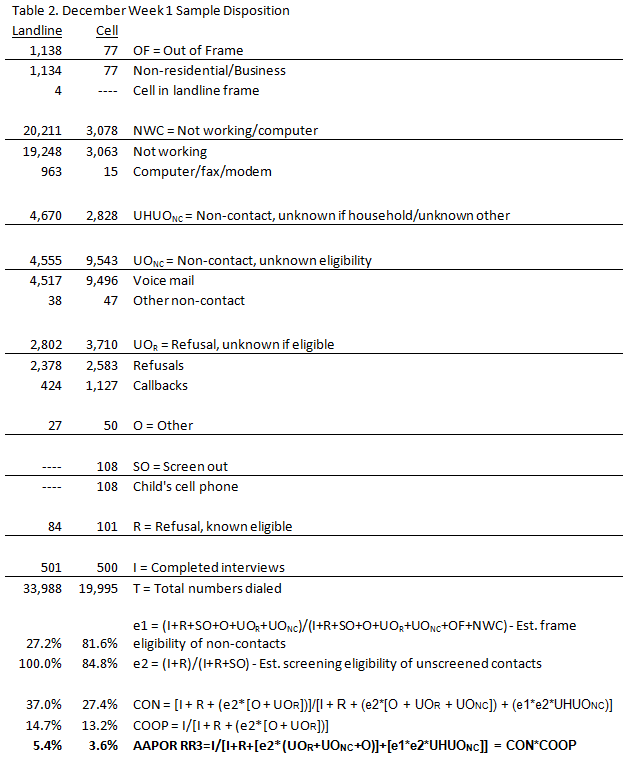
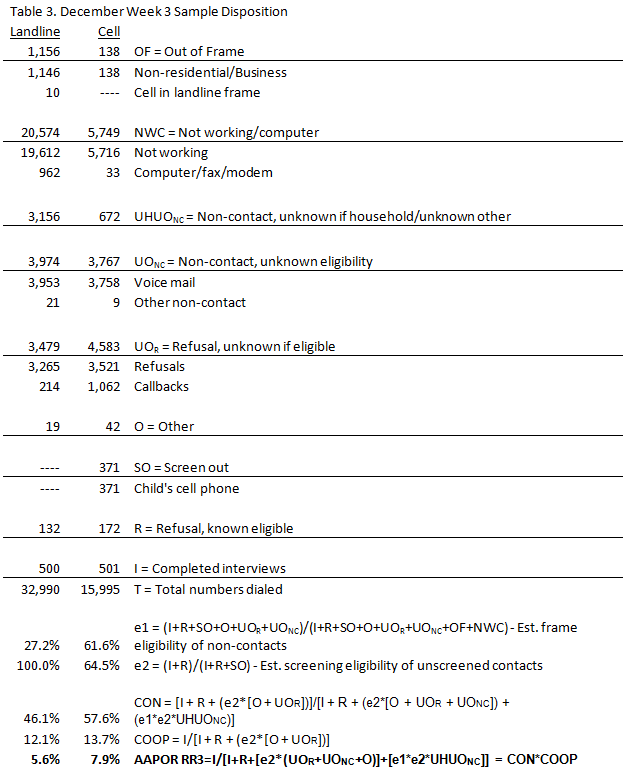
Response Rate
Tables 2 and 3 report the disposition of all sampled telephone numbers ever dialed from the original telephone number samples. The response rate estimates the fraction of all eligible sample that was ultimately interviewed. Response rates are computed according to American Association of Public Opinion Research standards. Thus for December Week 1, the response rate for the landline samples was 5 percent and the response rate for the cellular samples was 4 percent. For December Week 3, the response rate for the landline samples was 6 percent and the response rate for the cellular samples was 8 percent.