In certain key respects—their use and ownership of technology, for example—these Haiti text donors differ dramatically from the population as a whole. However, in other respects—such as their attention to news events or their participation in groups—they are little different from other Americans.
Haiti text donors in our survey are avid technology users
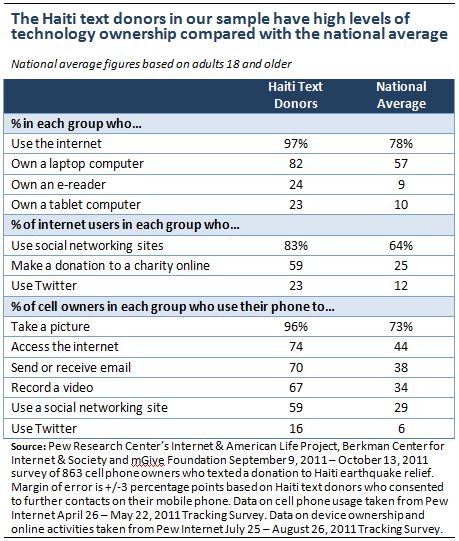
The Haiti text donors surveyed stand out from the adult population as a whole in their ownership and use of technology. Compared with the national average, these donors are significantly more likely to use the internet; own a tablet computer, e-reader or laptop; use their mobile phones for a number of activities, such as accessing the internet or using social media; and go online to make a charitable donation or access a social media site.
The Haiti text donors in our survey are about as active in social or civic groups as other Americans
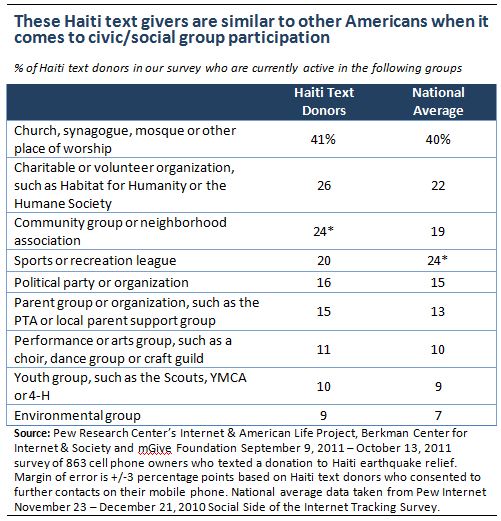
Although their technology profile differs substantially from the rest of the population, these Haiti mobile givers are nearly identical to other Americans when it comes to group involvement. The survey asked these donors whether they are currently active in nine different types of civic or social groups, and three quarters (73%) indicate that they are active in at least one.7 Looking at the different types of groups to which they belong, these Haiti text givers are slightly more likely than Americans as a whole to be active in a community or neighborhood group, and slightly less likely to be active in a sports or recreation league—but otherwise look almost identical to the national average in their group participation.
Haiti text donors in this sample communicate with their groups in a number of ways, although email and face-to-face contact are their preferred methods
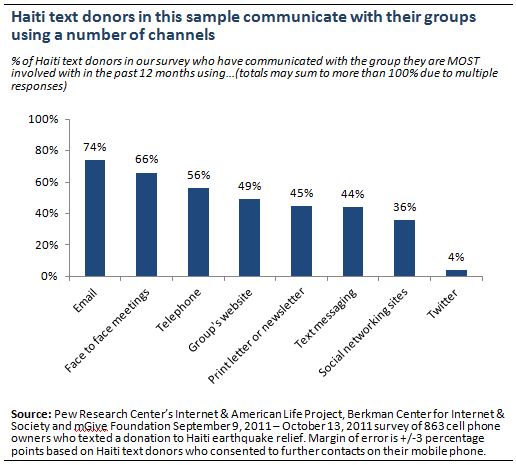
The Haiti text donors surveyed report using a number of channels to communicate with other members of the groups to which they belong, with email and face-to-face meetings being the most common and Twitter the least common. The typical (median) group member has used four different channels to communicate with other group members in the preceding 12 months.
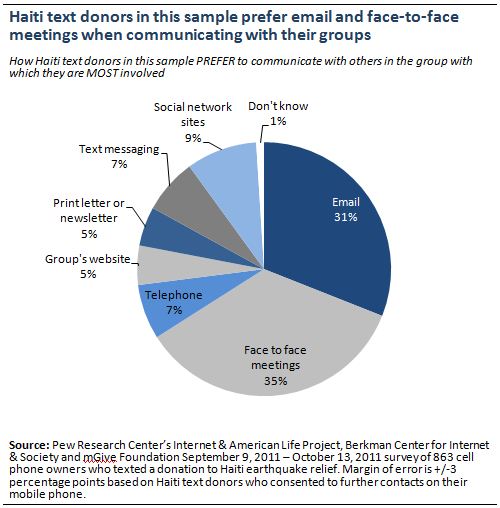
Not only are email and face-to-face meetings the most prevalent forms of group communication, they also lead the alternatives as the most preferred method for communicating with other group members. When asked how they prefer to communicate with other group members, 35% of these Haiti mobile givers cite face-to-face contact while 31% cite email. Social networking sites are the next most commonly mentioned communication method, cited by 9% of Haiti text donors in this survey who are active in any groups.
Face-to-face and email contact are the most preferred modes of group communication among every major demographic subgroup. However, there is some minor variation around race and ethnicity, as black Haiti donors in our survey are roughly twice as likely as whites to prefer communication via telephone (13% vs. 6%) and text message (11% vs. 6%). White donors in our survey are more likely to prefer email contact (37% vs. 21%), and are also slightly more likely to prefer using a website when they need to communicate with other group members. Additionally, college graduates prefer email communication (39%) by a slight margin over face-to-face meetings (34%) when they need to interact with their groups.
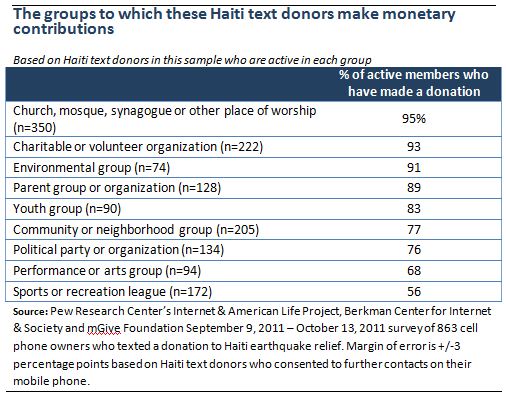
Most of the Haiti mobile donors in our survey who belong to a group have contributed money to that group, and their general giving habits are similar to the population as a whole
Nearly all of the 73% of Haiti text donors in this survey who belong to a group or organization, have made a monetary contribution to their group(s) in the past—although they are more likely to donate to some groups compared with others. At the upper end of the spectrum, roughly nine in ten of the Haiti text donors in this sample who belong to a group affiliated with their place of worship, a charitable or volunteer organization, an environmental group or a parent group or organization have made a monetary contribution of some kind to those groups. Conversely, around two-thirds of these donors who belong to a performance/arts group, or a sports/recreation league, have made a contribution to these groups.
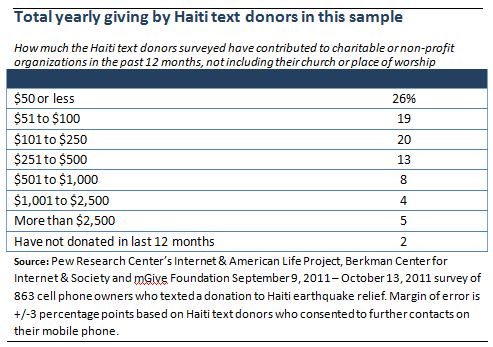
Along with asking whether they have ever donated to the specific groups in which they are active, the survey also asked Haiti text donors in this sample how much they have contributed overall to charitable or volunteer organizations in the previous 12 months—regardless of whether they are actually a member of those organizations.8 The largest group (comprising 26% of the Haiti text donors surveyed) donated $50 or less over the past twelve months, and two thirds of these donors have contributed $250 or less to charitable causes in the last year. However, this question garnered a wide range of responses as nearly one in five (17%) donated more than $500 to charitable or non-profit organizations over that time period and one in ten (9%) donated more than $1,000. These figures largely mirror charitable giving habits within the population as a whole. Using a slightly different question wording in a 2008 survey, we found that roughly six in ten charitable givers in the overall population had contributed $250 or less in the preceding twelve months, while roughly one in five had contributed more than $500.
Although the Haiti text donors in our survey look similar to the national average in their overall charitable giving habits, they—as well as text donors more generally—differ in important ways from the overall universe of charitable givers. Compared with those who have made any sort of charitable donation in the previous twelve months:
- Mobile givers are younger than the overall population of charitable givers. In our 2008 national survey, we found that 14% of those who had made any kind of charitable donation in the preceding twelve months were between the ages of 18 and 29, while 16% were 65 or older. By contrast, both text givers as a whole and the Haiti donors in this sample are much younger—roughly 30% of both groups are between the ages of 18 and 29, while just 5% of these Haiti donors and 4% of all text donors are 65 or older. Put another way, young adults are roughly twice as prominent among text givers as they are among charitable givers as a whole.
- Mobile givers are more racially and ethnically diverse than the overall population of charitable givers. Whites comprise three-quarters (75%) of all charitable givers, but make up two-thirds (63%) of this sample of Haiti donors and just half (51%) of all text donors. African Americans comprise an especially large proportion of the mobile giving universe—they represent 8% of all charitable donors based on our 2008 national survey, but comprise 17% of those who have texted a donation of any kind and 18% of the Haiti donors in this sample.
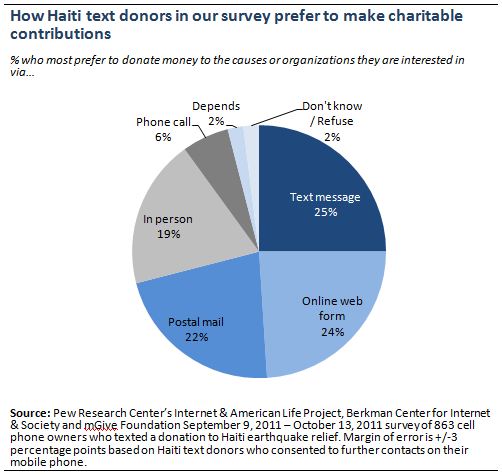
These Haiti donors equally prefer to make contributions via email, in-person, online or by text message—but do not care for donating money over the phone
When asked how they generally prefer to contribute money to causes or organizations, these mobile donors provide a range of responses with no one method standing out as the clear favorite. Online web forms and text messaging are preferred only slightly to in-person and postal mail donations, although donating via phone call trails all other options by a significant margin; just 6% of Haiti text donors in this sample prefer to donate over the phone.
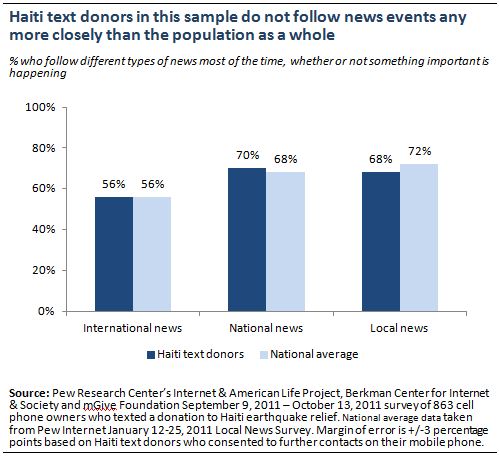
Compared with the national average, Haiti text donors in this sample are not especially focused on news events
The Haiti text donors surveyed are not especially fixated on international news compared with the population as a whole. When asked which statement best describes them when it comes to international news consumption, 56% of these Haiti donors say that they follow international news closely most of the time regardless of whether something important is happening, while 43% indicate that they usually only follow international news when something important happens—each of these is nearly identical to overall population responses from previous Pew Internet surveys. Moreover, these Haiti text donors follow international events less closely than they follow either national or local news, although here as well they are similar to Americans as a whole.
Neighborhood characteristics
When asked how much impact people like themselves can have in making their community a better place to live, roughly one third of the Haiti text donors surveyed (37%) feel that they can have a “big impact”, and close to half (46%) feel that they can have a “moderate” impact. Just over one in ten (14%) feel that they can have only a “small” impact, and 3% feel that they have “no impact at all” on making their community a better place. Overall, these figures are comparable to the national average for all US adults as established in previous Pew Internet surveys.
In terms of where they live, the Haiti text donors in this sample are relatively recent arrivals to their current neighborhoods in comparison to the national average. Roughly half (49%) have lived in their current neighborhood for five years or less, compared with 35% of all US adults who said the same in a recent Pew Internet survey. However, despite being more recent arrivals to their current neighborhood these text donors are not dramatically less likely to know their neighbors. Twenty-two percent of these donors know the names of all their neighbors and 54% know some of them, both of which are close to rates for the adult population as a whole (28% and 48%, respectively).


