Main Report
13% of online adults use Twitter, and half of Twitter users access the service on a cell phone
As of May 2011, 13% of online adults use the status update service Twitter. That represents a significant increase from the 8% of online adults who identified themselves as Twitter users the first time we asked our “stand-alone” question about Twitter adoption in November 2010.1

For the first time in our May 2011 survey, we also included a follow-up question asking cell phone-owning Twitter users2 if they access the service on their phones and found that half (54%) access the service in this way. Due to sample size limitations, we are unable to provide detailed statistics on mobile Twitter usage by different demographic groups.
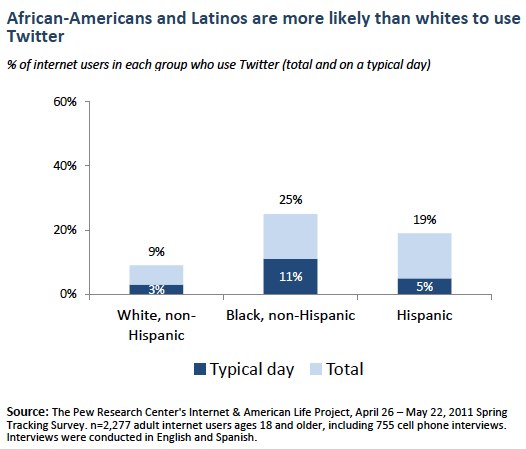
Twitter adoption is particularly high among non-whites
Non-white internet users continue to have higher rates of Twitter use than their white counterparts; indeed, the Twitter adoption gap between African-Americans and whites has increased over the past six months. In November 2010, there was an eight percentage point difference in Twitter use between African-American and white internet users (13% for blacks vs. 5% for whites). By May 2011, that gap was 16 percentage points—25% of online African Americans now use Twitter, compared with 9% of such whites. African-American and Latino internet users are each significantly more likely than whites to be Twitter adopters. Even more notable: One in ten African-American internet users now visit Twitter on a typical day—that is double the rate for Latinos and nearly four times the rate for whites.
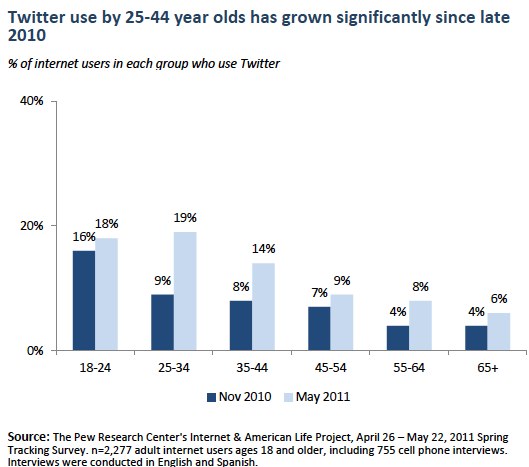
Twitter usage by those ages 25-44 has grown significantly since late 2010
Although young adults continue to have relatively high rates of Twitter usage, the number of 30-49 year olds who use the service has doubled since late 2010—from 7% of such users in November to 14% in May 2011. This growth trend is especially pronounced among 25-34 year olds—Twitter use for this cohort roughly doubled between November 2010 and May 2011, from 9% to 19%—although growth in Twitter use among internet users ages 35-44 was notable as well (from 8% in late 2010 to 14% in spring 2011). By contrast, Twitter adoption over the same time period was stable among the youngest adults (those ages 18-24) who were the most likely to use the service in our first survey.
Methodology
This report is based on the findings of a survey on Americans’ use of the Internet. The results in this report are based on data from telephone interviews conducted by Princeton Survey Research Associates International from April 26 to May 22, 2011, among a sample of 2,277 adults, age 18 and older. Telephone interviews were conducted in English and Spanish by landline (1,522) and cell phone (755, including 346 without a landline phone). For results based on the total sample, one can say with 95% confidence that the error attributable to sampling is plus or minus 2.4 percentage points. For results based Internet users (n=1,701), the margin of sampling error is plus or minus 2.7 percentage points. In addition to sampling error, question wording and practical difficulties in conducting telephone surveys may introduce some error or bias into the findings of opinion polls.
A combination of landline and cellular random digit dial (RDD) samples was used to represent all adults in the continental United States who have access to either a landline or cellular telephone. Both samples were provided by Survey Sampling International, LLC (SSI) according to PSRAI specifications. Numbers for the landline sample were selected with probabilities in proportion to their share of listed telephone households from active blocks (area code + exchange + two-digit block number) that contained three or more residential directory listings. The cellular sample was not list-assisted, but was drawn through a systematic sampling from dedicated wireless 100-blocks and shared service 100-blocks with no directory-listed landline numbers.
New sample was released daily and was kept in the field for at least five days. The sample was released in replicates, which are representative subsamples of the larger population. This ensures that complete call procedures were followed for the entire sample. At least 7 attempts were made to complete an interview at a sampled telephone number. The calls were staggered over times of day and days of the week to maximize the chances of making contact with a potential respondent. Each number received at least one daytime call in an attempt to find someone available. For the landline sample, interviewers asked to speak with the youngest adult male or female currently at home based on a random rotation. If no male/female was available, interviewers asked to speak with the youngest adult of the other gender. For the cellular sample, interviews were conducted with the person who answered the phone. Interviewers verified that the person was an adult and in a safe place before administering the survey. Cellular sample respondents were offered a post-paid cash incentive for their participation. All interviews completed on any given day were considered to be the final sample for that day.
Weighting is generally used in survey analysis to compensate for sample designs and patterns of non-response that might bias results. A two-stage weighting procedure was used to weight this dual-frame sample. The first-stage weight is the product of two adjustments made to the data – a Probability of Selection Adjustment (PSA) and a Phone Use Adjustment (PUA). The PSA corrects for the fact that respondents in the landline sample have different probabilities of being sampled depending on how many adults live in the household. The PUA corrects for the overlapping landline and cellular sample frames.
The second stage of weighting balances sample demographics to population parameters. The sample is balanced by form to match national population parameters for sex, age, education, race, Hispanic origin, region (U.S. Census definitions), population density, and telephone usage. The White, non-Hispanic subgroup is also balanced on age, education and region. The basic weighting parameters came from a special analysis of the Census Bureau’s 2010 Annual Social and Economic Supplement (ASEC) that included all households in the continental United States. The population density parameter was derived from Census 2000 data. The cell phone usage parameter came from an analysis of the January-June 2010 National Health Interview Survey. Following is the full disposition of all sampled telephone numbers:
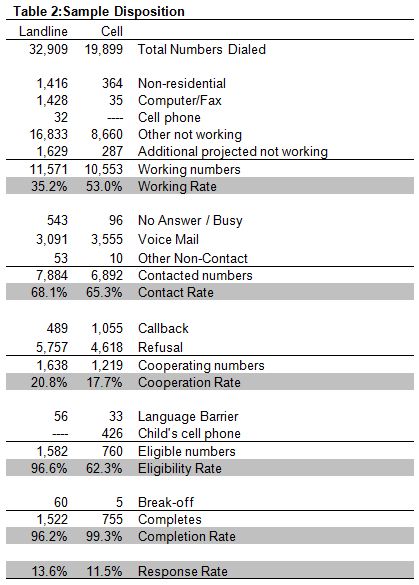
The disposition reports all of the sampled telephone numbers ever dialed from the original telephone number samples. The response rate estimates the fraction of all eligible respondents in the sample that were ultimately interviewed. At PSRAI it is calculated by taking the product of three component rates:
- Contact rate – the proportion of working numbers where a request for interview was made
- Cooperation rate – the proportion of contacted numbers where a consent for interview was at least initially obtained, versus those refused
- Completion rate – the proportion of initially cooperating and eligible interviews that were completed
Thus the response rate for the landline sample was 13.6 percent. The response rate for the cellular sample was 11.5 percent.


