Trends in broadband adoption
Some 63% of adult Americans have broadband internet connections at home, according to the April 2009 survey conducted by the Pew Research Center’s Internet & American Life Project. This figure compares with 55% recorded a year earlier and the eight percentage point increase translates into a 15% growth rate from May 2008 to May 2009. The growth rate is comparable to those recorded in the past three years.
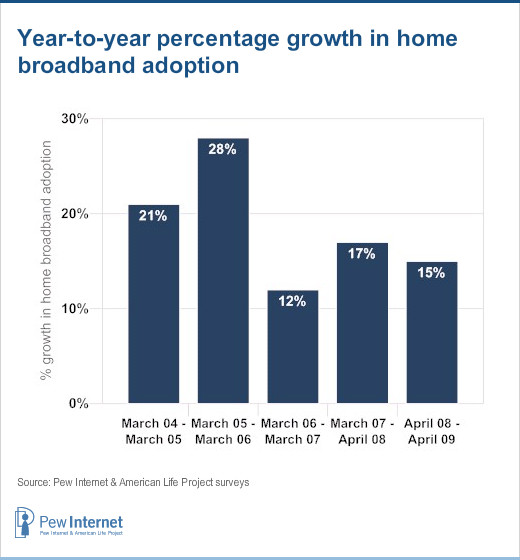
Although growth in the past year differs little from the March 2007-April 2008 timeframe, the latest broadband figure marks a departure from sluggish growth in broadband adoption for the latter part of 2007 and much of 2008. Pew Internet Project surveys over the twelve month period starting in December 2007 showed broadband adoption as follows:
- 54% of adults with broadband at home in December 2007.
- 55% of adults with broadband at home in April 2008.
- 57% of adults with broadband at home in August 2008.
- 57% of adults with broadband at home in December 2008.1
The April 2009 survey interviewed 2,253 adult Americans, including 561 who were interviewed on their cell. The margin of error in the survey is plus or minus two percentage points for results based on the entire sample. The survey contained 1,332 respondents with high-speed internet connections at home and the margin of error for results based on home broadband users is plus or minus 3 percentage points. The data points above for December 2007 and December 2008 both come from surveys with cell phone numbers included in the sample.
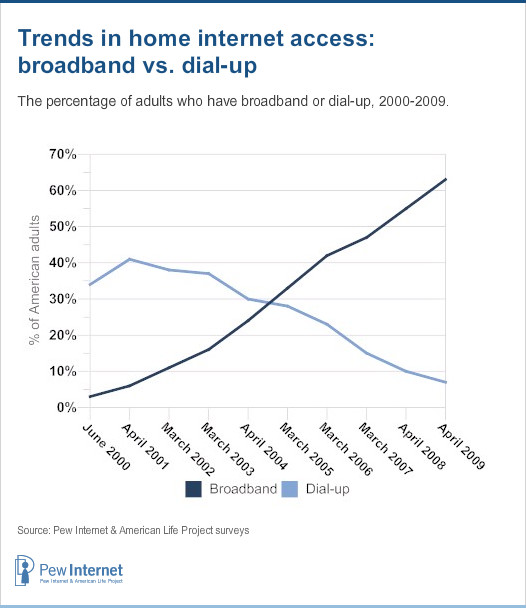
With five out of eight of Americans now connecting to the internet at home with a high-speed internet connection, dial-up access is the at-home onramp to the internet for only 7% of adults, half the level of two years ago.
The 63% home high-speed adoption figure occurs in the context of 79% of American adults identifying themselves as internet users in the April 2009 survey, with 72% of adults saying they go online from home. This means that, among adults who go online from home, 87% connect using some sort of broadband internet connection.
Here are trends in broadband adoption, as a share of all adult Americans, from 2000 to 2009.
The broadband adoption figure of 55% from our 2008 report came from a sample of respondents that did not include individuals interviewed on cell phone, unlike the 2009 sample. The difference in sampling may have an impact on a 2008-2009 comparison, since those reached on cell phones may have systematically different broadband adoption habits than those reached on landline phones. Analysis of the effect of including cell respondents in the April 2009 survey indicates that this may increase the figure for home broadband adoption by 2 percentage points. In other words, absent cell phone respondents in the sample, 61% of Americans would be found to have broadband at home.
The Pew Internet Project is now conducting all its surveys with cell phone numbers included in the sample. The latest data from the Center for Disease Control’s National Health Interview Survey show that 20% of American homes are cell-only.2 Including cell phone numbers in samples increases the number of younger respondents, minority respondents and low-income respondents that are collected in a survey and therefore makes the raw sample more representative of the general population.
Trends within demographic groups
The following two tables decompose trends in broadband adoption across demographic and socio-economic characteristics of respondents.
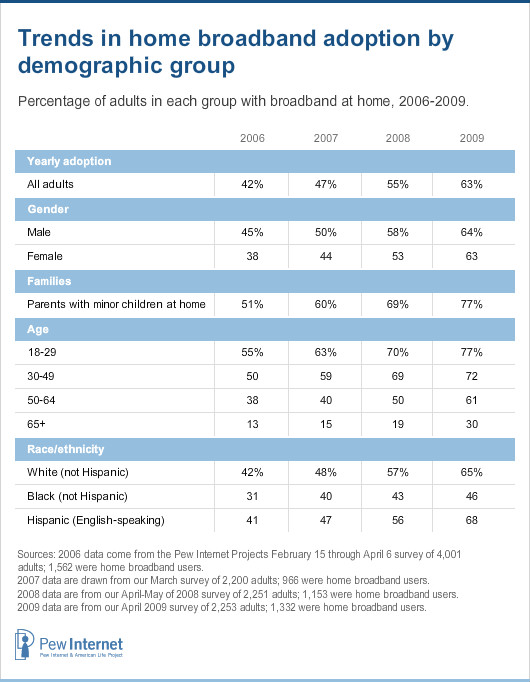
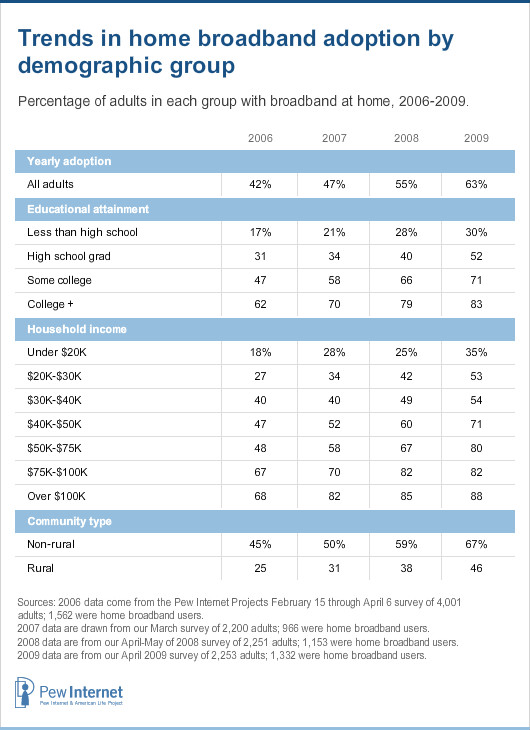
In looking across these tables, several groups stand out as having gained a great deal from 2008 to 2009, while several show gains that are below average.
On the upswing, starting with the largest gainers, are:
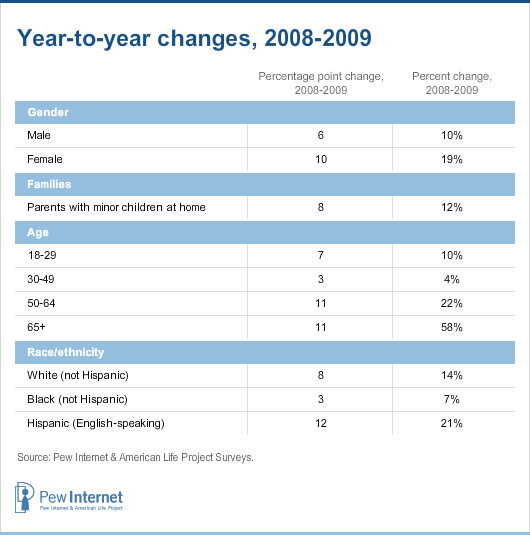
- Senior citizens: Americans age 65 and older had broadband adoption grow by 58% from 2008 to 2009, from 19% to 30%.
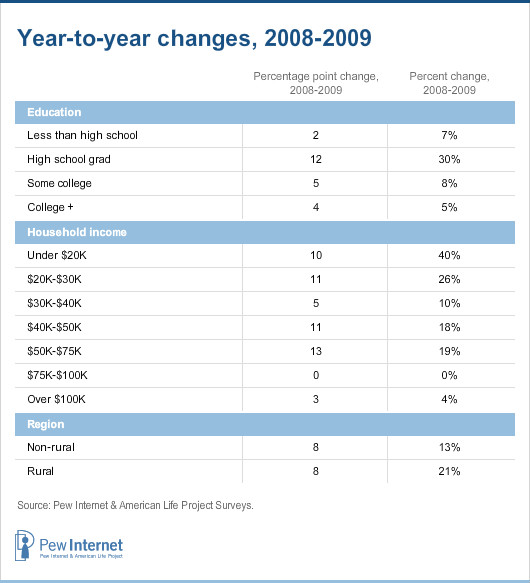
- Low-income Americans: Those who report household incomes of $20,000 per year or less (16% of the sample) saw broadband adoption growth from 25% in 2008 to 35% in 2009. This 40% growth represents a reversal of fortune from the 2007 to 2008 timeframe, when this group saw a slight (and not statistically significant) drop in broadband penetration from 28% to 25%.
- Another group of low-income Americans, the 10% of respondents living in households with incomes between $20,000 and $30,000 annually, saw broadband adoption grow from 42% to 53%, or a growth of 26%.
Overall, the one-quarter of Americans living in homes with annual household incomes below $30,000 experienced a 36% growth in home broadband adoption from 2008 to 2009.
- High school graduates: Americans whose highest level of educational attainment is a high school degree (which amounts to 35% of the sample) experienced an increase of broadband adoption of 30% from 2008 to 2009, from 40% to 52%.
- Older baby boomers: Americans in the 50 to 64 age group saw an increase in home broadband adoption from 50% to 61% last year, a 22% increase from 2008 to 2009.
- Rural Americans: Adults living in rural areas had a 21% increase in broadband adoption last year, as 46% of rural Americans now have broadband at compared with 38% in 2008.
Groups whose growth rate trailed the average include (starting with slowest growing):
- Upper and upper middle-income Americans: Respondents who report annual household incomes over $75,000 saw a small uptick in home broadband adoption from 84% to 85% last year – groups whose adoption levels are approaching a saturation level. These groups are some 24% of the sample.
- Ages 30-49: This large swath of Americans (36% of the population) saw broadband adoption rise 4% from 69% in 2008 to 72% in 2009.
- College educated Americans: Respondents with college degrees or higher (29% of the sample) witnessed a modest increase in broadband adoption from 79% to 83% last year, a 5% growth rate.
- African Americans: Among non-Hispanic African Americans (11% of the sample), broadband adoption increased from 43% in 2008 to 46% in 2009. This change is not significant statistically and represents the second consecutive year that African Americans have had below-average growth in home broadband adoption.
The preceding tables characterize the place where users live as rural or non-rural, a departure from past practice of identifying where people live by rural, urban, or suburban locations. It is straightforward to identify the locations of respondents using landline phones according to the Census Bureau’s definitions of rural, urban, or suburban. This is more difficult for respondents contacted on cell phones, since blocks of cell phone numbers do not neatly map to Census definitions of urban, suburban, and rural. However, samples of cell phone numbers do include the Metropolitan Statistical Area (MSA) in which the cell phone was activated, which is a close proxy for where the user lives.
Respondents who do not live in MSAs live (to a very close approximation) in rural areas and in this report such respondents are categorized as rural residents. It is challenging, though not impossible, to differentiate urban from suburban residents using MSA codes. That effort is not undertaken here and the cost of doing this is small; the difference between urban and suburban broadband penetration in the past has never been more than 3 percentage points, usually favoring suburbia.


