Personal finances and choices about personal information technology
The rise in home broadband adoption, in the face of a severe economic recession, may seem surprising, as taking on the additional cost of a home high-speed connection might be difficult if discretionary income is tight. On the other hand, the migration to the internet of many resources for finding and applying for jobs may prompt some to cut something else and keep (or add) broadband.
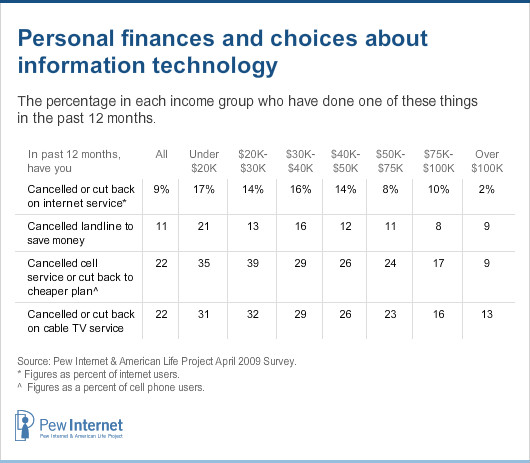
In probing this issue in the April 2009 survey, it appears that few people were willing to cutback on broadband and were more likely to economize on communication services other than the internet. As the table shows, just 9% of internet users said they cancelled or cut back on internet services in light of their personal finances.
The higher incidence of this among low-income users, in face of the increase in home broadband adoption in this group, suggests that respondents were taking steps to minimize their monthly bills as opposed to terminating service. This is probably also the case for cell service, since this survey showed 85% of all adults as having a cell phone, up from 77% in late 2007. For low-income people especially, the landline phone was cut, as well as level of cable TV service, rather than broadband.
How broadband users connect at home
A half dozen years ago home broadband access generally came in two flavors – cable or DSL services provide by telephone companies. Since then the range of options has expanded. Even though most home broadband users still have DSL or cable modem service, wireless access has made a significant dent among home broadband users, and fiber-to-the-home also registers as a high-speed access path for users.
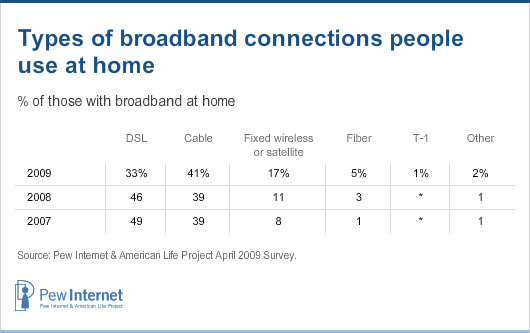
One reason the “fixed wireless or satellite” category may show sizable growth from 2008 to 2009 is a modification of the question used to measure home broadband access. The wording of the question is as follows:
“At home, do you connect to the internet through a dial-up telephone line, or do you have some other type of connection, such as a DSL-enabled phone line, a cable TV modem, a wireless connection, a fiber optic connection or a T-1?”
This year, the interviewer conducting the survey was permitted to prompt the respondent, for the wireless choice, about whether he had an AirCard service. This might have elicited some additional “wireless” responses than in the past.
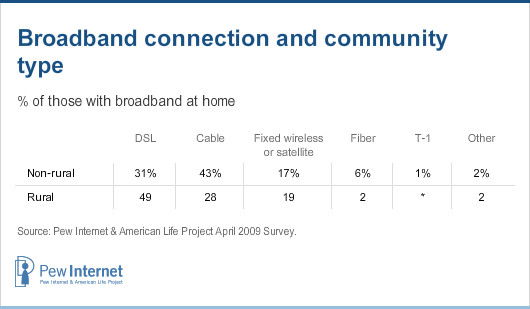
Looking at connection by geography shows clear differences depending upon whether one lives in a rural, urban, or suburban area.
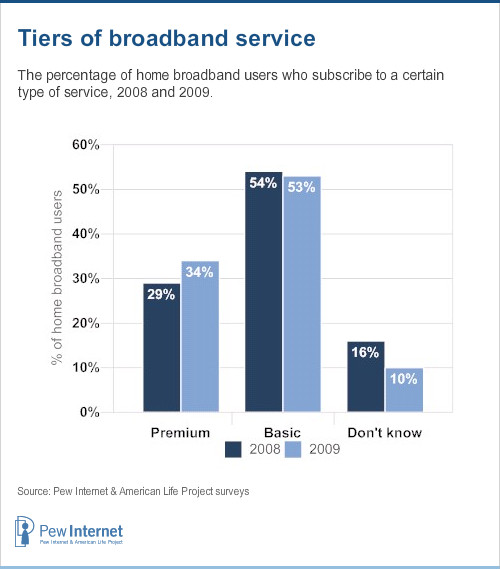
Another element in the mix of access decisions for users is speed. Some providers of broadband service offer different tiers of service differentiated by speed and price. In 2009, respondents were asked whether they “pay extra for a premium service that promises faster speeds” and 34% of home broadband users said they did. This represents an increase from 29% who said this in 2008. Here’s how respondents characterized their connection choices in 2008 and 2009.
The number of providers available to subscribers
Home broadband subscribers, for the first time since 2005 in a Pew Internet survey, were asked whether there is more than one provider of high-speed access serve their area. In 2009, more than two-thirds (69%) of home broadband users said they have more than one provider in their area, 21% responded “no”, indicating that there is a single provider, and 10% said they didn’t know. In 2005, by contrast, 61% of home broadband users said they had more than one provider serving their area, 25% said there was only one, and 13% responded that they did not know.
Among rural broadband users, 30% say in 2009 that they have one broadband subscriber where they live.
Broadband users with more than one high-speed provider where they live were further probed about how many companies served the area in which they live.
Among home broadband users with more than one option for broadband in their neighborhood:
- 29% said they had two choices.
- 39% said they had three choices.
- 24% said they had four or more choices.
Non-rural dwellers are most likely to say they have four or more choices; 32% say this. This is indicative of how denser population areas are more attractive investment opportunities for providers of broadband, as there is a greater chance for providers to recoup high fixed cost in these areas.
What people pay for online access
To explore what people pay for month for broadband, all home internet users in the April 2009 survey received this question: “To the nearest dollar, about how much do you pay each month for internet access at home? If your internet access is combined with television or other services, I would like to know just the amount you pay for internet service.”3
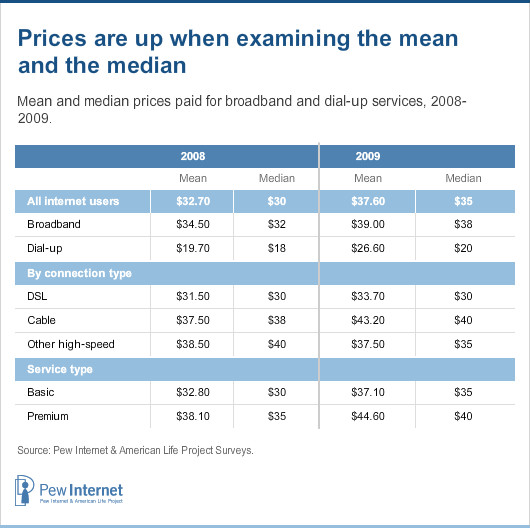
Overall, internet users reported an average monthly bill of $37.60 in the April 2009 survey, with broadband subscribers saying they pay an average of $39.00 per month and dial-up users report a monthly bill of $26.60. The 2009 figure for dial-up compares to the $19.70 dial-up users reported paying in 2008.
Prices for broadband are up
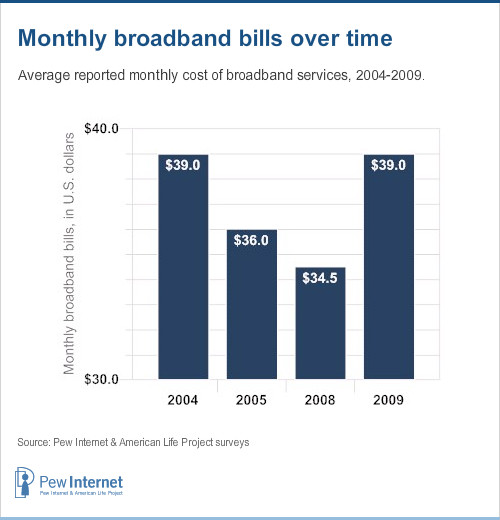
Comparing users’ reported monthly broadband bill in 2009 to past years shows an increase in what people pay for high-speed internet access on a monthly basis. The figure below shows that broadband users pay, on average $4.50 per month more in 2009 than in 2008, a difference that is statistically significant.
The increase in what people pay for broadband is evident in prices for basic and premium services. For subscribers to basic services, the average monthly bill was $32.80 in 2008, a figure which rose to $37.10 in 2009. For premium subscribers, those thirsty for faster home broadband speeds paid about $38.10 per month in 2008 and roughly $44.60 in 2009.
Across different service types, broadband subscribers reported higher prices for cable modem service than DSL by a $43.20 to $33.70 margin. This compares with 2008 figures of $37.50 for cable modem subscribers and $31.50 for DSL users.4
To put the average monthly broadband bill of $39 per month into context, an assessment of prices across countries for broadband, conducted by the Organization Economic Cooperation and Development (OECD) finds an average monthly broadband bill in the United States of $45.52.5 The OECD notes that in compiling its price average, it was not always possible to decompose the broadband price from “triple play” offerings of voice, internet, and video services; this may be a reason the OECD figure exceeds the one reported by users in this survey.
Choice and price
With data on what people pay per month for broadband and the number of providers they say they have in their neighborhood, it is possible to examine relationships between choice and price. As might be expected, broadband users who say they have more than one broadband provider report that they pay less per month for broadband than those who say only one provider is available. Specifically:
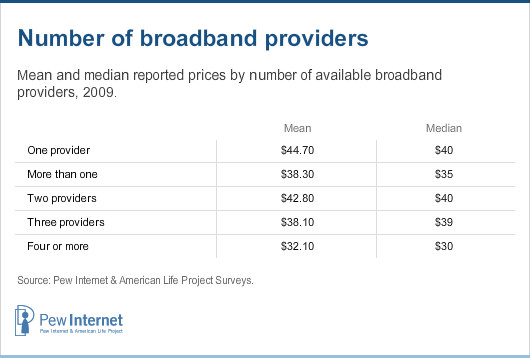
- Among broadband subscribers who report that one company serves their area, the average monthly bill is $44.70.
- Among broadband subscribes who report that more than one company serves their area, the average monthly bill is $38.30.
At a more disaggregated level, a greater number of choices among providers correlates to lower broadband bills. Specifically:
- Among broadband subscribers who report two providers in their area, the average monthly bill is reported to be $42.80.
- Among broadband subscribers who report three providers in their area, the average monthly bill is reported to be $38.10.
- Among broadband subscribers who report four or more providers in their area, the average monthly bill is reported to be $32.10.
It is possible that the differences in price reported for those with one broadband provider versus those with more than one are a result not of fundamental price differences, but user choices. For instance, the differences could arise from some users paying more for premium services or additional high-speed options such as mobile broadband services (e.g., AirCards). Although paying for premium services and mobile broadband does account for some differences in reported monthly bills, there is nonetheless a significant relationship between having more than one broadband provider available and having a lower monthly bill for broadband. In other words, the reported price differences between those with one provider versus those with more than one are significant, even when controlling for other factors that might effect people’s broadband bill, such as having premium service, paying for a wireless broadband service for “on the go” access, where they live, and other variables such as income and education. In this sample, living in a rural area had no significant link to average monthly broadband cost.%%FOOTNOTE%%
Prices are up when examining the mean and the median
Even with respondents prompted to disentangle price for internet service from other bundled offerings, it is sensible to ask how well they performed in doing that. Some users, notwithstanding suggestions to the contrary, may report the entirety of their monthly cable TV, telephone, and internet bills. Such high reports of prices would increase the calculated average of monthly internet service. In examining the data, this issue does not appear to be too severe. Only 2% of broadband users reported monthly bills that might be considered problematic – $100 or more. Some 3% of dial-up users reported monthly internet bills over $100.
Nonetheless, one way to explore the robustness of the increase in internet prices from 2008 to 2009 is to examine the median price levels. By focusing on the “middle” price reported in the dialup and broadband categories, the influence of potentially inaccurately high reported monthly bills is muted. Focusing on the median does not change fundamental relationships in price over the 2008 to 2009 timeframe, with the exception of DSL, where the median price was $30 in both years.
It is worth noting that the increase in the median for broadband prices overall is driven to some extent by the growth in the median among other types of home high-speed connections. That reported median grew from $35 to $40 from 2008 to 2009, and those kinds of connections accounted for about one-quarter of home broadband connections in 2009.
The 2008 survey on broadband use did not ask broadband users about the number of service providers they have available. However, the following table shows mean and median reported prices by number of available broadband providers.
The growth in wireless home networks
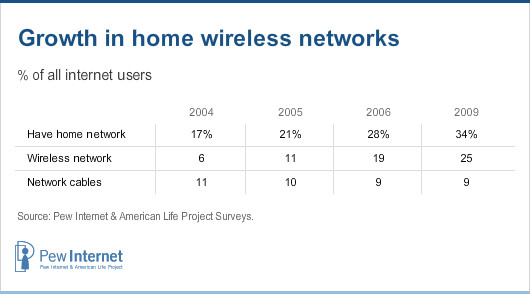
Another characteristic of the home internet experience is whether it is networked or not. Since 2004, the Pew Internet Project has periodically asked whether computers in the household are linked together through a network, either through cables or a wireless network. As the following table shows, home networking has been steadily on the rise, with the growth of home wireless networking accounting for this growth.
Both dial-up and broadband users were asked this question, and some 15% of dial-up users said they had wireless networks – something that is usually associated with having high-speed service. However, about half of these dial-up users reported having a service for wireless broadband, such as an Aircard or some such plan through their cell phone carrier.
For home broadband users, wireless networking is popular, with 37% saying they have a wireless network in their home. Wireless home networks are somewhat more prevalent among parents with minor children at home (42%) or married couples without kids at home (40%).


