Introduction
American households vary in the relationship of household members to each other and in their ownership of technology. While households can be separated into numerous categorizations, our survey identified six major categories that are discussed here in further detail. The apportionment of family types in our sample was quite close to the groupings measured by the U.S. Census Bureau and a comparison appears on page 32.
Married-with-children households have more education and higher incomes.
Married couples with minor children
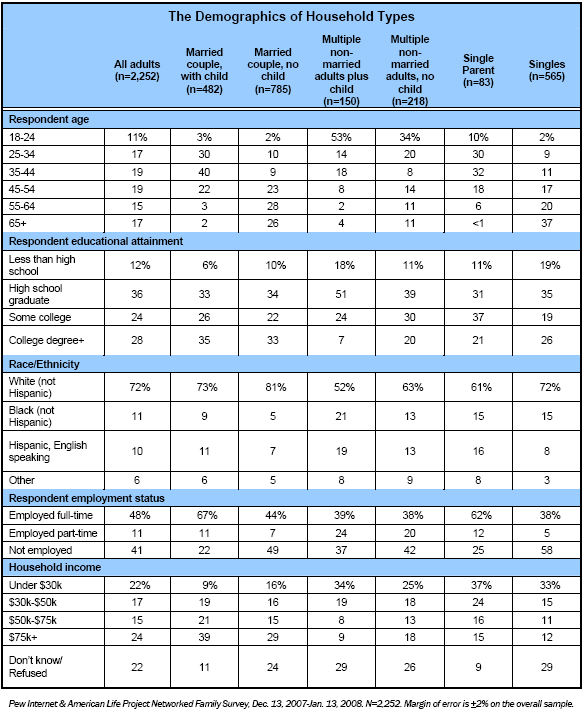
Couples with one or more minor children living at home make up 25% of respondents to our survey.4 Within this household type, 89% are formally married, while 11% are living with a partner as if they are married. In comparison to other family types, married-with-children families stand out as both highly educated and high-income. One in three of the married/partnered adults in these families (35%) have a college degree (among the highest rates of any household) and just 6% have not graduated from high school (by far the lowest of any household type). Nearly 40% of those married with children have an annual household income of $75,000 or more.
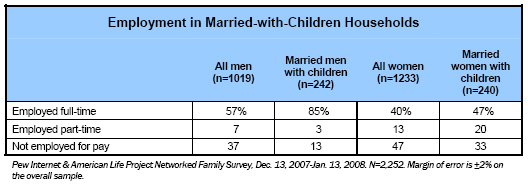
For men and women, marriage and childrearing are associated with high levels of employment. Across all family types, men are more likely to be employed than women. While this trend holds true for married couples with children, rates of employment for both men and women are higher in these households than in the population as a whole.
Married couples without minor children
One in three adults (29%) live in households with a spouse or partner but without minor children. Of these, 90% are adults who are formally married while 10% are living as married (partnered). Compared with couples who have minor children at home, married couples without children tend to be older: 54% of these individuals are 55 years of age or older. They are the second highest income group, behind those who live in married with children households, but substantially ahead of adults who live in other types of households. They are more likely than others in our sample to be white and to be relatively well educated: 33% hold a college degree.
Multiple non-married adults in household, plus minor children
This household type, which comprises 9% of the households in our survey, is by far the youngest group. Fully 53% of individuals in such households are ages 18-24 and two-thirds are under age 35. They might be comprised of a grandmother, mother and child, or a mother and a housemate with a child/children. Befitting their youth, the members of this group are among the most likely of the household types we studied to have not completed college: 69% are high school graduates or did not complete high school and just 7% have college degrees. This group has the lowest proportion of whites and the highest proportion of minorities (21% are black and 19% are English-speaking Hispanics).
Multiple non-married adults in household, no minor children
This household type comprises 12% of households in our survey, and is similar to the group listed above. Those living in households with a group of other adults and no children are somewhat younger than other household types – more than half (54%) are under age 35. It is a group split evenly among those who ended their education with a high school diploma or less (50%) and those who at least started to go to college (30% have some college education and 20% more have graduated). It is ethnically diverse: 63% are white and 26% are visible minorities. They are predominantly middle income.
Single parents
This group comprises a relatively small number of respondents to our survey, so robust statistical analysis is not possible. Generally speaking, these households tend to be headed by single mothers, lower-income, concentrated in Gen X and Gen Y (up to age 44) and racially diverse.
Single-person households
This group comprises 22% of all households in our survey, and is by far the oldest group: 37% are 65 or older and only 11% are under age 35. It is relatively less well-off cohort: 48% make less than $50,000 per year.
Married couples with children are most likely to own key technologies.
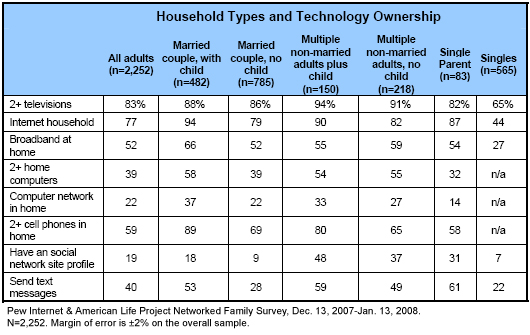
Married couples with children stand out for their technology and gadget ownership, including cell phones and computers. Some of the reason is household size. These are the largest households, and the more people in their households, the more coordination and communication they need. For example, where a two-person household (married couple or single mom with child) has only two relationships to coordinate (one in each direction), a four-person household (mother, father, and two children) has twelve relationships to coordinate. Other factors at play include the relatively higher socioeconomic standing of this cohort.
More than nine in ten married with children families (93%) have a desktop or laptop computer and nearly six in ten (58%) own two or more. In addition, 37% of such families (and 63% of those with multiple computers) have a wired or wireless home computer network. These home computer networks frequently go hand in hand with a high-speed home internet connection: two-thirds of such families (66%) have a home broadband connection.
Within the context of families that are married with children, both spouses and children are likely to be internet users. Fully 93% of such families contain at least one parent who uses the internet. Indeed, both spouses go online in three-quarters (76%) of these families; and 84% of their children ages 7-17 go online. In total, two-thirds (65%) of the married-with-children households in America with a child age 7-17 contain a husband, wife and child/children who all use the internet.
Families that are married with children are also very likely to be cell phone owners. Fully 89% of such families own more than one cell phone, 47% have three or more, and one in five (22%) have four or more mobile devices. For parents, the patterns of cell phone use are similar to those for internet use—both parents own a cell phone in 78% of such families. However, children are less likely to own a cell phone than they are to go online. Where 84% of children age 7-17 in such families go online, a lower 57% have a cell phone of their own. In total, 44% of the married-with-children households in America contain a husband, wife, and child age 7-17 who all use cell phones. .
Older children in married-couple families are more likely than younger ones to have a cell phone. This is consistent with previous Pew Internet research showing that older teens are much more likely to use a cell phone than younger teens.5
Married couples without children living at home tend to be older and own less personal technology than married couples with children.
Compared with married couples who have children at home, married couples without children at home have technology ownership rates closer to the overall average for all families. At least one family member uses the internet in 79% of married-without-children households, significantly lower than the rate for married families that have children at home.
Just over half of married-without-children couples (52%) have a high-speed home internet connection, the same as the overall average for all Americans. Also, while rates of cell phone ownership among married couples without children are lower than for couples with children, seven in ten couples without children (69%) own more than one cell phone.
Single-person households, the oldest of the family types in our survey, are the least likely to have adopted new technologies.
Singles are the oldest group. They also have by far the lowest rates of technology adoption of any of the family types in our survey. Among the family groupings discussed here, singles have the lowest rates of cell phone ownership (61%), home computer ownership (48%), overall internet usage (44%) and home broadband adoption (27%).
“Non-traditional” family arrangements such as single-parent households tend to be young, tech-savvy, and ethnically diverse.
Although single adults and married households with and without children comprise the most prevalent family arrangements in our survey, several other family types are appreciably represented in the study: single parents and multi-adult families not living as married who are with or without children under the age of 18.
These households are notable for their embrace of social networking and text messaging, a phenomenon that is likely influenced by the relative youth of many members of these groups. Use of social networking sites is particularly high within these household structures—31% of single parents, 37% of those in multi-adult households, and nearly half (48%) of those in mixed multi-adult/child households have a profile on a social networking site. Additionally, 49% of those in multi-adult households, 59% of multi-adult/child households and 61% of single parents send text messages.


