Introduction
In 2002, the Project’s “Email at Work” report declared that few working Americans who had incorporated email into their work lives felt overwhelmed by it. In fact, most felt their email load was manageable and most were pleased with the way email helped them to do their job. In 2008, while email is still the well-functioning artery of workplace communications in many professions, there is much more to consider when examining work-related use of communications technology. Over the past six years, as internet and email use have grown, so too have the array of devices, applications and complications that arise from their use.
Questions about work-life balance, what counts as overtime work, and the extent to which personal online activity can spill into normal working hours have become more pervasive as the internet is integrated into many workplaces. Even those working in the new media industry are struggling to establish norms for workplace issues that arise with the always-on connectivity that the internet affords. Writers for the television network ABC recently protested a new policy that stated they would not be compensated for any time spent checking email after normal working hours on their company Blackberries.2 However, “normal working hours” no longer exist in many professions, and there are often not clear lines suggesting fair compromises when technology use is so pervasive in and outside of the office. While ABC was trying to avoid paying time-and-a-half overtime for every idle minute that a writer might spend checking for messages, the writers, who can often end up spending hours on work-related exchanges via email at home, were equally concerned that they would not be properly compensated for their work.
Whether in or outside of the office, those who use the internet for work may also see their employers’ monitoring of their online activities grow more restrictive. Firms’ ability to block various kinds of sites is becoming more granular and their reach extends beyond the walls of the office. Many workplaces routinely monitor employees’ in-office use of the internet for various abuses, and advances in security and filtering technology are increasingly giving employers even more options for policing use of the company’s network that may happen from afar.3
This report, based on findings from the Networked Workers Survey, represents the Project’s first dedicated inquiry into the technological assets of today’s workers and their attitudes towards ICT use as part of their job. The Networked Workers Survey was fielded among a nationally representative sample of 2,134 adults in the U.S., including 1,000 self-identified full-time and part-time workers. The survey was conducted by Princeton Survey Research Associates International from March 27 to April 14, 2008, and the margin of sampling error for the complete set of weighted data is ±3%. The margin of error for results based on workers is ±4%.
This survey provides a snapshot of technology use by American workers.
In this survey, we find that employed Americans make up 53% of our survey population.4 We find in our poll that of those employed, 16% are self-employed and 84% work for someone else. Close to one in three (30% of employed Americans) work for large corporations, and 28% work for small businesses. The remaining 39% of employed Americans work for medium-sized companies, for the government, in educational institutions, or in the non-profit sector.
When it comes to particular professions, about one in five employed Americans are professionals, such as lawyers, doctors, teachers, and accountants. Another fifth of Americans works as secretaries, receptionists, sales clerks and in similar office positions. The third most common jobs are those in the service industry, such as waiters, hairstylists, fire or policemen, and janitors, accounting for 17% of employed Americans. Other respondents are divided between business executives and owners, skilled trades such as electricians and plumbers, and semi-skilled trades such as truck and bus drivers. Another 10% of Americans, including consultants, farmers and musicians, do not fit into any these categories (falling into an “other” category referred to throughout the report).
Most working Americans use the internet or email at their workplace.
Among those who are employed, 62% could be considered “Networked Workers” who use the internet or email at their workplace.5 Networked Workers are not only connected while at work, but they are also more likely than average Americans to have access to a wide array of technological assets outside of the workplace. They are more likely to own cell phones, desktop and laptop computers, and personal digital assistants (PDAs).
Among Networked Workers:
- 93% own a cell phone, compared with 78% of all American adults.
- 85% own a desktop computer, compared with 65% of all adults.
- 61% own a laptop computer, compared with 39% of all adults.
- 27% own a Blackberry, Palm or other personal digital assistant, compared with 13% of all adults.
Networked Workers: The 62% of employed adults who use the internet or email at work
Nearly half of all working Americans do at least some work from home.
While measures of at-home work and telecommuting by government agencies and private research firms have varied extensively, our latest data suggest that the ranks of at-home workers may have grown considerably in recent years.6 When asked how often, if ever, they work from home, 45% of employed respondents in our sample reported at least some amount of at-home work. The segment who routinely work from home is more modest (18% do so every day or almost every day), but 37% of employed Americans say they are working from home at least as often as a few times per month.
Work at home: 18% of employed adults work from home every day or almost every day.
By comparison, a 2006 study conducted by the Harvard School of Public Health found that just 27% of employed respondents were working from home, with 18% doing so at least as often as a few days per month.7
Networked Workers who use the internet or email at their job report higher rates of working at home. Overall, 56% report some at-home work and 20% say they do so every day or almost every day.
Those in the highest-earning occupations are more likely to work from home.
Whether working at home in lieu of going into the office, or simply working extra hours at home, those in the top earning categories are far more likely than lesser-paid employees to do at least some work from home. More than two-thirds (69%) of employed adults earning $75,000 per year or more say they work from home at least some of the time, one in four do so every day or almost every day. By comparison, just 30% of those in jobs earning less than $30,000 per year work from home, and 12% do so every day or almost every day.
Nearly all workers use new information and communication tools in some way.
Beyond those who are actively using the internet or email at their workplace, there is an even larger group of workers who are armed with technological tools that can keep them connected to their jobs outside of normal working hours. Among those who are employed, 96% are in some way making use of new communications technologies—either by going online, using email or owning a cell phone. We refer to these respondents as “Wired and Ready Workers,” as they represent the broader group of working Americans who are using information and communications technologies inside and outside the workplace.
Wired and Ready Workers: The 96% of employed adults who are in some way making use of new communications technologies—either by going online, using email or owning a cell phone.
This group includes employed respondents who are either internet users (86%), have a cell phone (89%) or an email account (81%). Additionally, some 73% of workers use all three basic tools of the information age: they use the internet, have an email account, and have a cell phone.
Most working adults are satisfied with their jobs.
Overall, employed Americans are satisfied with their jobs—a trend that has been largely consistent over the past twenty years. Nine out of ten Americans are at least mostly satisfied, with 57% mostly satisfied and 33% completely satisfied with their jobs. Only 10% are either mostly or completely dissatisfied. These results are consistent with the 2008 Pew Social & Demographic Trends survey, which reports that 31% are completely satisfied and 56% are mostly satisfied with their jobs.8
Past polls by Gallup indicate that Americans’ general feelings of satisfaction toward their jobs have remained relatively unchanged over the past couple decades.9 A 1989 Gallup poll reported that 89% of working Americans were either completely or somewhat satisfied with their jobs and only 11% were dissatisfied. Ten years later, in 1999, another Gallup poll showed that 86% of employees were completely or somewhat satisfied with their jobs; 14% were dissatisfied. Now, 90% of employed Americans are satisfied with their jobs, according to a 2008 Pew Internet survey.
Those who earn the most also report the highest levels of job satisfaction.
Looking at demographics, job satisfaction levels are at their highest among those in the top earning groups. Fully 98% of employed Americans making over $75,000 a year are satisfied with their jobs, significantly more than any other income group. Fully 38% of those in the highest earning bracket say they are completely satisfied with their jobs, and 61% say they are mostly satisfied. That compares with just 31% of those earning less than $30,000 per year who are completely satisfied, and 57% who are mostly satisfied.
Self-employment and certain job types are associated with higher levels of satisfaction.
Self-employed respondents are significantly more likely than those who work for someone else to be completely satisfied with their jobs; 42% of self-employed Americans are completely satisfied with their jobs compared with 31% of non-self-employed who are equally satisfied.
Respondents also find some occupations more satisfying than others. Ninety-four percent of managers and business owners are satisfied (mostly or completely) with their jobs, notably more than the 86% of service workers and 80% of skilled-trade workers who are satisfied with their jobs. Also, 93% of professionals and 90% of clerical workers are satisfied with their jobs – significantly more than the percentage of skilled-trade workers who are satisfied at work.
Job satisfaction may also be related to teamwork. Employed adults who have worked with five or more work groups over the past month (43%) are more likely than those who have worked with just one other group (26%) to be completely satisfied with their jobs. Those who have not worked with other teams are significantly more likely to be dissatisfied with their jobs (12%) than employees who have recently worked with five or more work groups (6%). Job satisfaction does not vary significantly according to company type, internet use at work, number of hours worked, supervisor status or work at home options.
Supervisors are heavier at-work internet users.
Fully 87% of employed Americans report to at least one person at work, and the majority of workers are overseen by only one or two supervisors. Almost half (46%) of employed respondents report to only one person, while about a quarter (23%) of respondents report to two people at work. Eighteen percent of employed Americans report to three or more people. Eleven percent of employed respondents do not report to anyone at all.
Some 42% of workers in our sample supervise other employees at work daily. About 84% of those who supervise other employees also report to at least one supervisor themselves. Furthermore, of employed Americans who oversee others at work, more than one-third (36%) say that the employees they supervise also supervise other employees. These supervisors who are in charge of multiple levels of staffers are significantly more likely to use the internet constantly or several times a day at work than those who supervise at only one level. Nearly 74% of multi-level supervisors use the internet at least several times a day at work while only about 54% of single-level supervisors use the internet as often at work.
Most workers report little tenure at their current place of employment.
One hallmark of this era is that there is considerable churn in the job market and even inside companies. Most working Americans have been at their current place of employment for a relatively short period of time. Fully 58% of job-holding Americans have been working for their current employer for fewer than seven years and 30% have been working for that employer for two years or fewer; compared with 42% of employed respondents who have been with their current employer for eight or more years and 20% who have been with their employer for 16 years or more.
Many working Americans also have little tenure in their current positions at their place of employment. Fully 39% of employed Americans started their current position within the past two years. This number is significantly more, than the number who have been in their current position for 3-7 years (29%). Just 18% have been with their current position for 8-15 years and only 13% have been in the same position for 16 years or more.
The Department of Labor offers similar statistics with regard to employee tenure:10
- Almost one out of four employed adults (24%) has been with their current employer for less than one year.
- A similar number (26%) have been with the same employer for 10 years or more.
- A little more than half (54%) have been with their current company for fewer than five years.
- Another fifth (21%) have been with the same company for 5-9 years.
Additionally, in 2006, employed Americans ages 25 and older averaged 4.9 years with their current employer, according to the Labor Department.11
Two in five American employees works overtime.
Significant numbers of Americans are working longer hours than the traditional 40-hour work week. Some 39% of workers say they put in more than 40 hours a week, compared with 31% who say they usually work 40 hours a week and 28% who say they work part time.12 Almost one-fourth (24%) of employed Americans – the majority of Americans who work overtime – work between 40 and 50 hours a week. Some 15% of working Americans work more than 50 hours a week; similarly, only 15% work fewer than 25 hours a week.
The number of hours Americans are working each week has remained relatively steady over the past 20 years. According to Gallup polls in 1989 and 1999, respectively, 13% and 12% of employed adults were working over 60 hours a week (compared with 11% in the current Pew Internet Project survey). Likewise, in the same Gallup polls, 46% and 41% were working 35-44 hours a week (compared with 41% in the Pew survey).13 According to the Gallup data, however, even as the number of hours Americans are working remains the same, employees are increasingly “completely satisfied” with the flexibility of their hours. In 2007, 68% of employed adults were completely satisfied with the flexibility of their hours, while in 1989 only 46% were completely satisfied.
Certain demographic groups, occupations and work environments tend to work longer hours.
Certain demographic groups – men, middle-aged employees and those earning more money – work longer hours.
Women are significantly more likely than men to work part time, and men are significantly more likely than women to work overtime. About 21% of women work fewer than 25 hours a week and 19% work between 26 and 39 hours a week, while only 10% and 9% of men work those respective hours. On the other hand, 29% of men work 41-50 hours and 21% work over 50 hours a week; 19% of women work 41-50 hours a week and only 8% work more than 50 hours a week.
Age is also related to the number of hours a person works. Employed 18-29 year-olds (23%) are significantly more likely to work 25 hours or less per week when compared with 30-49 year-olds (11%) and 50-64 year-olds (13%). Employed Americans in the middle age groups are significantly more likely, on the other hand, to work 41-50 hours a week. As noted in the table below, those earning higher incomes also tend to work longer hours.
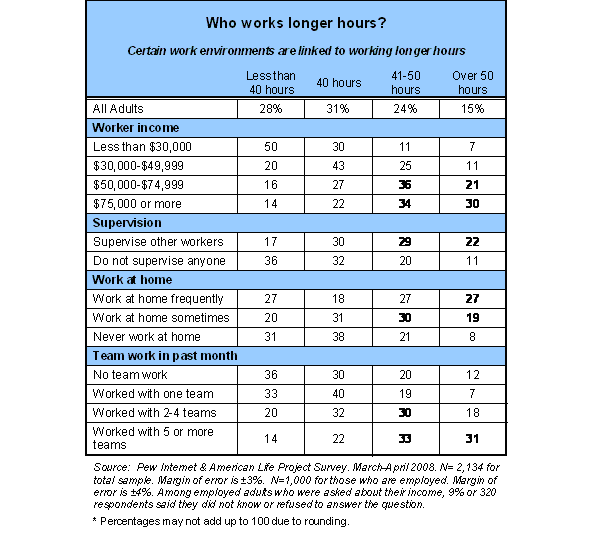
Some occupations and certain work environments tend toward longer working hours.
Managers and professionals are much more likely to work over 40 hours per week than employees in other job categories. Twenty-three percent of professionals work over 50 hours a week, significantly more than the proportion of clerical workers (10%), service workers (6%) or skilled workers (14%) who put in work weeks that long. The cohort of managers and business owners who work over 50 hours a week (24%) is also significantly more than clerical and service workers who work the same hours. Additionally, 36% of managers and business owners work 41-50 hours a week, significantly more than professionals (24%), clerks (21%) and service workers (14%) who work those hours.
The number of hours an employee works also varies by certain aspects of respondents’ work environment–such as supervision responsibilities, the ability to work at home and whether or not that employee works in teams. For instance, of employed Americans who supervise others, 29% work 41-50 hours a week and 22% work over 50 hours a week—considerably more than those who do not supervise anyone (20% and 11% respectively). Respondents who work at home frequently (27%) or sometimes (19%) are also significantly more likely to work over 50 hours a week than those who never work at home (8%).


