In laying out the important data collection questions, workshop participants touched on five themes, to be discussed in detail in this section of the essay:
- Productivity: Why are accurate measures of broadband and other information and communication technologies (ICTs) important to measuring the economic productivity?
- Public policy and government intervention: If government chooses to intervene in the communications market place (e.g., to fill gaps in infrastructure provision), is the necessary data available to help government officials make these decisions and assess their impacts?
- Measuring penetration rates: As technology continues to evolve rapidly, how should the government and other entities address the challenges in accurately measuring the technologies people have and how they use them?
- The internet and geography: If the internet has the potential to overcome geographic barriers, what data are needed to assess claims about the internet’s impact on urban or rural development?
- Culture and users’ environment: What research methods, data, and informationgathering strategies are needed to understand user behavior?
Productivity
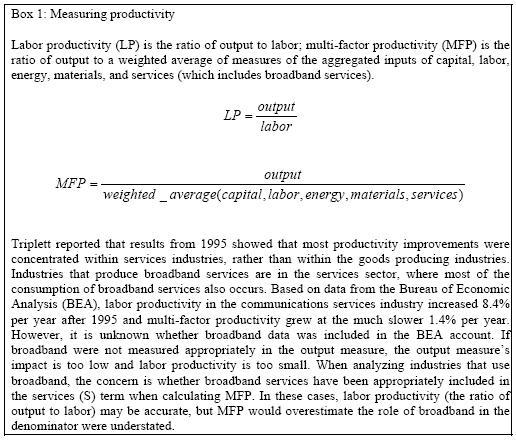
We see computers everywhere but in the productivity statistics, Robert Solow famously wrote in a book review in the New York Times in 1987.13 And with a masterful stroke, he coined the term “the productivity paradox.” Productivity is the measure of a technology’s contribution to the economy and is essential to understanding and analyzing the determinants of economic growth. Twenty years later, much has been learned about the impact of information technologies on productivity.14 However, as Jack Triplett explained in his opening remarks at the workshop, the advent of broadband affects two key measures: labor productivity and the more sophisticated measure called multi-factor productivity. Both measures have increased since 1995, especially labor productivity, and most of the growth has been concentrated in the service sector. Since, in economic statistics, broadband is classified in the service sector, flawed data collection methods that do not capture the technologies’ effects could significantly impact the productivity measures for the entire U.S. economy. Inappropriate representation of broadband distorts both labor and multi-factor productivity measures, and not in the same way (sees Box 1 for further detail).
Getting productivity wrong, as Shane Greenstein said, can affect a number of economic policy decisions, such as interest rates set by the Federal Reserve. Overstating productivity may be equally problematic if it results in excess investment in ICT that might be better directed toward other resources in the economy. Greenstein and his co-author Chris Forman of Carnegie Mellon University agreed that the contribution of broadband to productivity is an important question. But they noted it remains an open question as to the size of the contribution of ICTs to the U.S. economy. As Flamm asked in his introductory remarks, “Is it [broadband] big enough to merit separate measurement, and if not, the obvious question is when?”
In discussing ICTs, broadband, and productivity, workshop participants noted that distinctions between accounting for broadband and, say, personal computers. Personal computers can be counted, and the purchase is a single transaction, although it may trigger other purchases in the form of software, printers, and other hardware devices. In a business, the equipment becomes part of the inventory of assets, subject to depreciation. Broadband, on the other hand, is a service made available by providers, who must first make significant infrastructure investments before the first consumer can subscribe. For the consumer, broadband is an ongoing cost, like other utilities, not a one-time investment.15 The decision to acquire broadband is mediated by both availability and cost.
The local nature broadband service presents additional challenges. Broadband is, after all, mainly a wireline service provided at a particular geographic location. Consequently, it is reasonable to expect that part of its direct impact would be local (as well as any spillover benefits that may accrue over larger areas). Greenstein and Forman said that the best way to measure direct economic impacts of broadband is to focus on use by business establishments. Household use may have indirect effects on the economy but measuring it is more difficult. They posed three clusters of largely empirical questions that prompt examination of broadband use by industries and firms and help determine the economic impacts:
- What industries make the greatest use of broadband? How has this impacted their productivity? Which types of firms are most strongly impacted when broadband becomes available? When broadband prices decline or quality improves?
- Which areas of the country have been most affected by broadband in the last decade? Which areas would benefit most from increasing availability, declining prices and quality improvements in broadband? Which areas may have suffered from broadband’s diffusion (e.g., might a region whose comparative advantage depended on communications infrastructure suffer from the widespread deployment of high-speed networks elsewhere?)?
- What technologies generally complement broadband? What clusters of technologies are needed to realize broadband’s benefits? What investments follow broadband? How does broadband impact spatial organization of productive activities? Firm organization? How has business use of broadband shifted in response to concerns over information security? Has this varied by industry?
Some studies that address these questions are already underway. Since the 1990s, there has been active interest in collecting demographic information on computer use at the household level, led by the work of the Census Bureau. Furthermore, the increased use of remote access, wireless connectivity, and always-on connections are beginning to blur the distinction between life at work and life at home. Avi Goldfarb of the Joseph L. Rotmann School of Management at the University of Toronto outlined questions on individual, household, and commercial uses. Goldfarb addressed questions such as, “Where are American goods finding markets when there are no transport costs?” and “What goods are Americans buying?” He speculated that clickstream data, captured at the desktop (or keyboard), could prove helpful in understanding online behavior on a more intimate and granular scale than has heretofore been feasible.
Sharon Gillett, at the time with the Massachusetts Institute of Technology and now chairman of the Massachusetts Department of Telecommunications and Cable, together with her colleagues William Lehr, Carlos Osorio, and Marvin Sirbu, described research that was focused on measuring the impact of broadband on local economies. Using a zip-code-level panel data set based on broadband availability from the FCC, they examined the impact of broadband availability on the growth in employment, establishments, and industry composition. Their research finds that broadband contributes significantly to increasing the growth rates of all three. However, whether the higher growth rates represent a one-time or permanent improvement is unclear.
Problems with using zip code data to understand determinants of broadband deployment were addressed by Flamm, Tony Grubesic, a geographer now at Indiana University, and James Prieger of the University of California, Davis. They all concurred that the zip code data have a number of significant problems for analysis. These range from inconsistent zip code mappings, changes in zip codes over time, and difficulties in matching across various data sets (e.g., from the FCC data to the Census demographic data organized according to ZCTAs, the Census Bureau’s attempt to map its data into zip codes). The data collected by the FCC are critical and widely used. All of the speakers described problems with the FCC’s definition of broadband (greater than or equal to 200Kbps in one direction) and the definition of zip codes. Since the FCC is the principle source for national information on the geographic availability of high speed lines at relatively granular spatial units, difficulties in interpreting this data pose a serious challenge for research. Problems with this dataset are discussed in some detail in later sections of this essay.
Public policy and government intervention
Expanding availability of broadband infrastructure requires investment in both hardware and software. The case for such investments, whether undertaken by business or government, requires reliable data on the costs of deploying infrastructure and on expected consumer demand. Moreover, consumer demand changes over time as complementary goods make the service more attractive and as the population of broadband users matures from early adopters to mass market consumers. Thus, analysis of broadband markets requires both knowledge of the range of choices available in the market place as well as what consumers are doing with the services.
Rahul Tongia, of Carnegie Mellon University, who has studied infrastructure in emerging economies with a focus on technology and technology choices, emphasized this distinction between usage, which is typically measured by penetration rates, and access, or availability of the service. In the U.S., he said, dial-up access is ubiquitous because of the universal availability of telephone service, something not realized in much of the world. Furthermore, in contrast to the U.S., where dial-up and broadband access is available for a fixed monthly fee, in many other parts of the world, internet access is subject to time-metered usage tariffs. For example, in India, DSL costs just over $2 a month but usage is capped. Such policies mean that even where services are available, there may be barriers to usage that will limit demand for infrastructure and services.
Differences in the availability of broadband infrastructure, the regulatory and industry environment, and local demographic characteristics all contribute to significant cross-national differences in broadband penetration. Prieger observed that, according to OECD data, the U.S. is not currently in the top ten nations in terms of broadband per capita penetration. His work explores what might be done to address this situation and whether well-crafted policy will have an impact. Gregory Rosston of Stanford University has worked extensively on narrowband, which has lessons for broadband, and has found that “costs vary greatly across a state depending on cities and subsidy programs.” More recently, Flamm has found that programs at the state level affect broadband usage.16
To encourage universal availability of broadband, U.S. policymakers launched in 1997 the Schools and Libraries Program of the Universal Service Fund, commonly known as “E-Rate.” The E-Rate program is administered by the FCC and provides discounts through a competitive bidding process to assist most U.S. public schools and libraries to obtain affordable telecommunications and internet access. Early assessments, including one by the non-profit Benton Foundation, considered 17the program a success. But subsequent studies by the Congressional Research Service (2004) and the General Accounting Office (2005) raised questions about its management and utility.9 Anindya Chaudhuri, a colleague of Flamm’s at the LBJ School, described some of the issues associated with measuring the effectiveness of the now- $8 billion E-Rate program using the data from the Current Population Survey (Computer and Internet Use Supplement), the National Center for Educational Statistics, the decennial U.S. Census and the Universal Service Administrative Company. A critical unit is the school district. Unfortunately, the school district is not identified consistently across the key datasets so, he concluded, “There is no way to track the funds.”
In discussing Chaudhuri’s findings, Scott Wallsten of the Progress and Freedom Foundation argued that drawing conclusions about the effectiveness of broadband policies is difficult when the data underlying the analysis are flawed or inconsistent. Wallsten also discussed public policy and broadband deployment in a comparative U.S./international framework and identified four problems (which others echoed):
- Inconsistent definitions: The FCC definition of broadband as greater than 200Kbps makes it hard to compare broadband adoption across countries.
- Inadequate competition measures: The focus on broadband is too narrow as other things compete with broadband. For example, many Americans still use dial up. Dial up prices are falling and improvements in dial up are occurring.
- Poor indicators of speeds: Advertised speeds are not necessarily the same as delivered speeds.
- Poor measures of prices: There is a lack of information regarding how much people are willing to pay for higher speeds.
Measuring penetration rates
Frequent and reliable measures of broadband adoption at the national, regional, and even local level are important for a number of reasons. Economists seek to understand why broadband services are more available in some locales than others and whether this affects economic performance. Policymakers worry about the implications of “connectedness” on civil and political engagement. Traditionally, such research relies heavily on the public data assembled by the statistical agencies at the federal and, to a lesser extent, state level. This research also uses privately funded, independent surveys. As Greenstein, Forman, and Goldfarb noted, this research typically does not cover business uses, where there is substantial direct economic impact, but tends to examine use at home. This bias toward household use may be appropriate for mature markets, but may be less useful for understanding key adopter communities, since many people learned to use the technology at work or school. In general, the large, national scale surveys have provided good baseline demographic information, but they generally do not lend themselves to more sophisticated analysis of niche markets, like the early adopter communities.
The National Telecommunications and Information Administration (NTIA) has done a series of studies of computer and internet use at the household level, using the monthly Current Population Survey conducted by the Census Bureau for the Bureau of Labor Statistics. However, this program was discontinued in 2004 with the publication of the 2003 data. The Pew Internet & American Life Project, as well as the work done by the Center for the Digital Future at the Annenberg School at the University of Southern California, have continued to examine this topic, as have others, looking beyond basic demographic studies more generally to online behavior.
At the workshop, Horrigan summarized some of the extensive work that the Pew Internet Project has done on broadband penetration and discussed some of the limitations of its survey methodology.18 The project relies on a carefully structured, random-digit telephone survey design. Such surveys are appropriate for capturing a number of measures about users’ broadband experience, but less so for other important measures, such as network speed available to a user. Horrigan cited a Pew Internet survey that found that 81% of home high speed users could not identify how fast their home connection was.
The internet and geography
One of the initial promises of the internet was the ability to overcome geographic barriers. Productive activities could be distributed remotely and users could communicate via the internet. Today residential users and small business owners may now access remote storage and backup services over the internet, while companies of all sizes may avail themselves of outsourcing services impossible to support in a pre-broadband era. The physical location of the storage facilities is less important and may be optimized to take advantage of the relative trade-offs of falling bandwidth costs versus local real estate and power costs for maintaining the off-site storage facilities. Technical issues such as the choice of storage media and format migration may be outsourced, while issues such as how to protect individual privacy and confidentiality may become more important.
In spite of the internet’s promise of reducing the barriers of geographic distance, location continues to matter when economic and public policies are considered. Cross-national differences in data privacy rules or intellectual property protection may influence where data is stored and how it is routed when transmitted. Additionally, scale continues to matter. At the national level, population is not uniformly distributed, and markets for networked services have historically been clustered. In the U.S., telegraph lines and railroads in the 1840s and 1850s connected population centers. Initial deployment of telephony and electrical systems in the 1880s and 1890s followed similar contours. Decisions regarding the placement of infrastructure reflected trade-offs between technological constraints, notably signal attenuation, and profitability. In the early 20th century, constructing electrical power lines cost $2,000 per mile and with an average of 2-to-4 hook-ups per mile, extending lines to rural areas was considered infeasible.19 Moreover, with time, legacy systems and policy decisions affect availability, as Rosston’s work on narrowband suggests.
Local land use policies also play a role in the cost of infrastructure installation. Tongia pointed out that the availability of transit is a big determinant of pricing in rural areas. Issues such as the rights to attach new infrastructure to telephone or electric poles, control over conduit, and rights of way may vary by locale and may pose a significant impediment to the deployment of competitive infrastructure.
Geospatial studies of availability of and access to broadband are another research area in which data problems limit opportunities for important analysis. Indeed, use of geographic information systems (GIS) to support demographic and economic analyses formed a leitmotif in the papers as speakers described merging and layering diverse sources of demographic and social data on GIS scaffolds. This method yields a better understanding of penetration rates in a spatial context and the geographic impacts of policy measures.
Grubesic has explored the intersection of geography and infrastructure and described his research on levels of broadband availability across urban, suburban, exurban, rural, and remote communities. Is there evidence of discriminatory practices by private providers, he asked, and does this behavior vary geographically? How can federal, state, and local policies motivate or deter the rollout of advanced services? Data problems constrain the ability to answer these questions. From a methodological perspective, when he looked at the zip code, which is a fundamental unit for the FCC and the Census Bureau, Grubesic found serious inconsistencies in definitions used by FCC and the Census Bureau, a point also made by Flamm and Prieger. The integration of the two datasets is critical, because layering them should allow researchers to take the demographic information from the Census Bureau and overlay it on the infrastructure information on the availability of high speed lines compiled by the FCC. This nexus between datasets turns out to be highly problematic because of inconsistencies in the definitions, and Grubesic concluded, “Spatial statistical approaches are highly susceptible to error when using zip codes as the primary unit of analysis.”
Zip codes are not the only spatial measure that researchers employ. Chaudhuri identified problems with definitions of schools districts that inhibited the ability to track public funding. David Gabel of the City University of New York warned that commonly used terms like “urban” and “rural” can be misleading and spatial units may be inconsistently defined or poorly understood. The Metropolitan Statistical Area (MSA), an entity defined by the Office of Management and Budget, is often associated with an urban area and a non-MSA area with a rural area. In its formal definition, “an MSA comprises the central county or counties containing the core, plus adjacent outlying counties having a high degree of social and economic integration with the central county as measured through commuting.” Thus, revisions to the MSAs result in new MSAs, removal of MSAs, as well as revisions to existing MSAs.”20 The term actually captures the notion of a social subdivision as much as a spatial unit, and as Gabel pointed out, there are often very large urban areas within an MSA. Since the physical definition changes with shifts in population, comparisons over time are difficult, particularly for environments like Washington, D.C., New Orleans, Atlanta or Los Angeles, where development may occur rapidly or even precipitously.
Culture and users’ environment
Complex cultural preferences may also affect users’ motivations to adopt technology. Sharon Strover and her students and colleagues at the Telecommunications and Information Policy Institute (TIPI) at the University of Texas at Austin have studied the cultural context of adoption in rural Texas. Strover’s research team combines GIS infrastructure maps purchased from private vendors, public data from several statistical agencies, ethnographic interviews and surveys that are mailed to prospective participants, followed by face-to-face interviews as needed. This strategy supports rich but focused analysis and also reveals bias in the data, resulting, in part, from data collection methods. Language and literacy skills, most notably, affect response rates. In their studies for the U.S. Department of Agriculture of sites in Michigan, Kentucky, Texas, roughly half (50%) of the population is Spanish-speaking. The Texas sites in the southern part of the state are nearly entirely Hispanic. Other well known but not insurmountable biases are suspicion of government (or a survey that is believed to be a government document), and race and gender, which affect not only who responds but what is said. The payoff to addressing these research challenges are great, Strover noted, as it yields a deep understanding of broadband’s impact on a community.
In expanding on the notion of context, Tongia emphasized the users’ “setting.” He noted the need for researchers to understand the impact of broadband by focusing not just on the infrastructure in the house or neighborhood, but also the devices and software applications they use. There is likely to be a lot of variation in that regard and not all users will have the most current software and hardware at their disposal.
During the first phase of deployment in the 1990s, Tongia continued, many users were introduced to the internet either through institutions of higher education or at work. The next major development was access at home, first through dial-up and then usually through DSL or cable modem to achieve broadband service, although other types of connections are available.21 Network engineers often talk about “fat pipes” as a colorful shorthand for fast or high-speed transmission. Tongia’s point is that a fat pipe to the corner is of little use, if only a pipette links the corner to the home or business. An old machine between the user and the website may compromise the user experience. Still, he commented, many consumers think DSL is slower than cable. Is that the truth, he asked, noting a distinction between a computer architecture and a commercial “marketecture”? And given the perception, how does that view impact competition? So there are two potentially conflated issues: what is out there? And what do ordinary people think is out there?
In engineering terms, answering Tongia’s questions requires information about the quality of long haul, second mile, and last-mile services and about end users’ usage patterns to appropriately measure people’s quality of service experienced. But these engineering measures are actually not well defined even among computer scientists. kc claffy of CAIDA, the Cooperative Association for Internet Data Analysis (http://www.caida.org/home/), which provides tools and analyses promoting the engineering and maintenance of the internet infrastructure including studies of internet traffic, described the “state of internet science” as “abysmal.” A well-known advocate for the importance of internet metrics, she listed several reasons for the paucity of data: no federal agency, including the National Science Foundation, is charged with this kind of data collection, and neither the providers, the users, nor the software developers have an incentive to collect or share the data. Yet the potential implications of traffic analysis are significant, as Tongia’s comments imply. They inform consumers’ mental model of what works and how well it works and therefore frame consumers’ decisions about what services to acquire and from whom.
Access to faster connections is one major change for consumers. A second is the expansion of wireless connectivity that enables individuals to connect without a wire tethering them to a specific location and thus moves one step closer to the vision of ubiquitous connectivity anywhere, anytime. Horrigan’s recent research for the Pew Internet & American Life Project found that roughly one-third of internet users accessed the internet with a wireless connection from home, work, or “some place else.”22 Public libraries and schools have long been third places after home and work, and the E-Rate Program was explicitly designed to foster expansion of access to the internet. In research completed since the workshop, Horrigan has documented ways in which access to wireless appears to signal deeper engagement with cyberspace. Wireless users check e-mail more frequently than other users and are also more likely to get their news online.
Wireless users also typically have broadband at home. Some 80% of wireless users have broadband connections at home, implying that wireless “represents a different quality of online behavior,” motivated perhaps by requirements at work or perhaps because it is easy with a personal digital device or a lightweight notebook computer. It is telling that 27 percent of adult internet users access the internet by wireless from some third place other than home or work in contrast to the 20 percent who use wireless at home and 17 percent who use wireless at work.23
WiFi “hotspots,” like coffee shops and waiting areas of airport terminals, are among these new third places. They are clearly important not only as another means of access but also because of their significance in the emergence of new behaviors and new relationships between people, information, and technology. At the workshop, Martha Fuentes-Bautista and Nobuya Inagaki at the University of Texas at Austin reported on their research into the social use of WiFi in public places. Their work focuses on three major issues:
- understanding broadband use as a continuous experience
- how and why people get access from different places and platforms;
- and how public wireless becomes the entry point for broadband use among the disconnected.
Fuentes-Bautista and Inagaki rely on interviews with employees as well as patrons of such venues to investigate these issues. But they have found it difficult to identify a comprehensive list of establishments from which to develop a sample for survey work. Corporate representatives or providers can be reluctant to disclose information that might be deemed proprietary. Patrons may represent relatively narrow segments of the population, and their willingness to participate may be inhibited by concerns about privacy and confidentiality of the data.
Data confidentiality is not only of concern to individuals who may see a threat to their privacy. Information has commercial value and companies guard their proprietary data as important assets. Richard Clarke, Director of Economic Analysis at AT&T, was one of several speakers who offered the industry perspective. He warned that information on penetration rates is extremely sensitive. In addition, it is important to measure quality of service (QoS) “appropriately,” because of the implications that a perceived advantage may have on the market shares of competing service providers. Charles White, Vice President of TNS Telecom, a major telecom market information company, agreed that the data that companies have is expensive to collect; before sharing it, commercial interests need to know how the data will be used.
