How Broadband is Spreading Through the Population
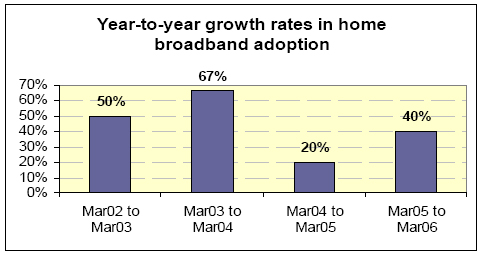
Broadband growth in the United States in early 2006 has resumed its fast upward trajectory. As of March 2006, 42% adult Americans – or 84 million people – have high-speed at home, up from 30% who had broadband at home in March 2005. This represents a 40% increase in the number of people with high-speed connections at home over a year’s time. To put this growth rate in context, in a comparable timeframe of a year earlier, broadband adoption at home grew by 20% from March 2004 to March 2005. The chart below shows growth rates in broadband adoption in recent years.
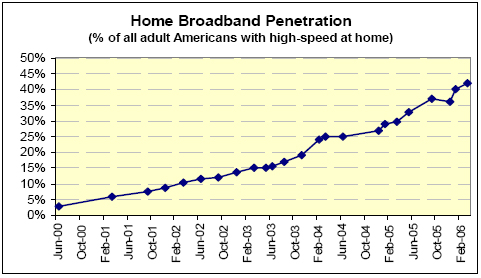
The 2005-2006 growth rate means that home broadband adoption has gone from single-percentage point penetration rates to over 40% of adult Americans in just six years’ time.
With 25 million more Americans using broadband at home in early 2006 than a year earlier – which was the entire population of home broadband users at the end of 2002 – it is worth asking about the sources of this growth. To some extent, the rise in broadband penetration is linked to growth in overall internet penetration since the end of 2004, with more new online users beginning their internet experiences with high speed connections than has traditionally been the case. Our surveys show that 60% of adult Americans were internet users during November 2004, a figure that stood at 66% in January 2005; as of March 2006, 73% of adults said they were internet users. Whereas 35% of new internet users (i.e., those online for a year or less) connected at home by high-speed in the winter of 2004, that figure increased to 45% for new internet users by the winter of 2005.
25 million more Americans were using broadband at home in March 2006 as compared to March 2005. That equals the total number of home high-speed users in the United States at the end of 2002.
A seven percentage point increase in internet penetration from 2005 to March 2006, with these new users signing up for broadband at the rate noted above, accounts for about 25% of home broadband growth. The remaining increase came from current users switching from dial-up to broadband. Although we do not have a panel of respondents to allow us to pinpoint exactly the source of the growth, the table below comparing penetration across demographic groups at the two points in time paints a picture of strong growth across a wide range of population segments.
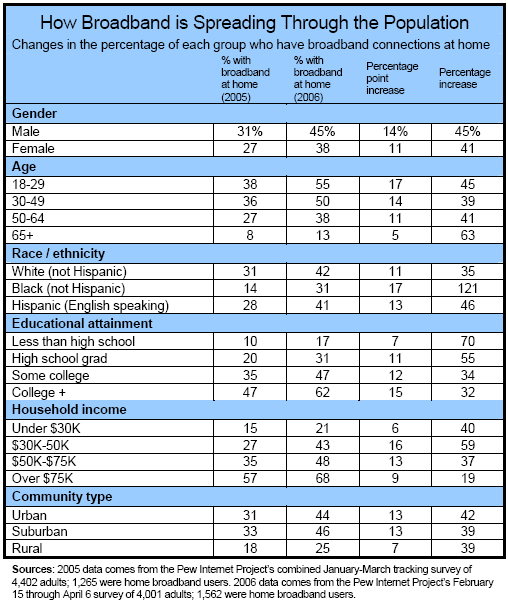
Relatively low adopters from 2005 had the largest growth rates into 2006. African Americans, for example, report a whopping 121% growth rate, which is both large and statistically significant. Four other groups exhibited rapid growth rates:
- Those who did not finish high school,
- Senior citizens,
- Those whose annual household incomes are in the $30,000 to $50,000 range,
- High school graduates.
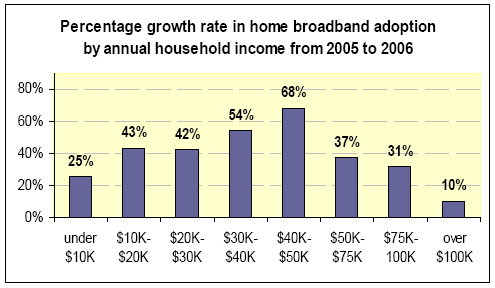
- The numbers for growth in lower income categories are important because it shows fast growth rates among a large segment of the population – approximately 40% of Americans tell us their annual household incomes are under the $50,000 threshold. In collecting data on income, respondents are asked to place themselves in one of eight income categories that are read to them. Many respondents – about 20% – opt not to provide this information. Of those who do, the median (or middle) category chosen is the fifth one – a household income between $40,000 and $50,000 per year.
The middle income category is the one which experienced the most growth in broadband adoption from 2005 to 2006. The chart below displays the growth rates from 2005 to 2006 across the disaggregated income categories.
Income is, of course, a factor in broadband adoption. As the table on page three shows, 15% of those who live in households with income under $30,000 annually have broadband compared with 57% of those in households whose incomes exceed $75,000 annually. But the data do show that broadband is no longer just the province of upper-income Americans.
As noted, many respondents do not tell us what their income is, but they do share whether they have high-speed connections at home. Among the roughly 20% of respondents who refuse to answer the income question, 22% had broadband connections at home in 2005; for respondents from our 2006 survey who did not provide information on income 31% had broadband at home. This is a growth rate of 41% from 2005 to 2006.6
DSL is starting to overtake cable in the broadband marketplace.
When asking people about their online connection speed, the survey question reads: “Does the computer you use at home connect to the internet through a dial-up telephone line, or do you have some other type of connection, such as a DSL-enabled phone line, a cable TV modem, a wireless connection, or a T-1 or fiber optic connection?” This yields not only whether people have broadband connections at home, but also the type of connection they use.
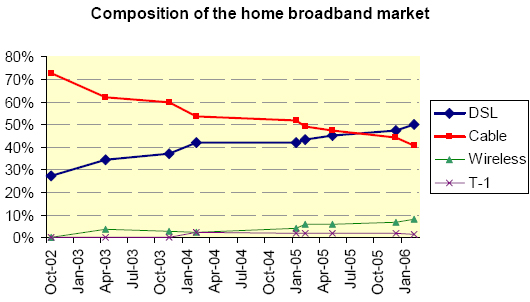
DSL providers have made steady progress over time in increasing their market share of home broadband. According to our March 2006 survey, 50% of those with high-speed connections at home log on using DSL compared with 41% who use cable modems. As a home high-speed connection, wireless has also increased its presence – from next to nothing in 2002 up to 8% of the home broadband market as of March 2006. This translates into approximately six million Americans who use a wireless connection to get online at high-speed at home.
In looking at the share of home high-speed users who use DSL versus cable modems, it is worth noting that the sample for the December 2005 survey was drawn from a list of landline telephone numbers. This excludes households whose only source of telephone access is from a cell phone – a growing group of Americans. A recent report from the Pew Research Center for the People & the Press shows that, when comparing responses from a landline sample with those from a sample that includes cell phone respondents (and cell-phone-only respondents), there are generally not significant differences across a variety of questions.7 However, differences were evident when focusing on how people get broadband at home. Including cell phone respondents narrows the advantage DSL has in market share by 5 percentage points in the Pew Research Center study. In the context of this report, that would reduce, but not reverse, the lead DSL currently has over cable modems. And it would not affect the trend in Pew Internet data that shows DSL steadily gaining market share in recent years.
The changes in market share have occurred while the market has grown. In February 2004, when 48 million adults had high-speed at home, 20 million had DSL connections and 26 million used cable modems. By March 2006, when 84 million adults had broadband at home, 42 million use DSL for high-speed compared with 34 million who use cable.
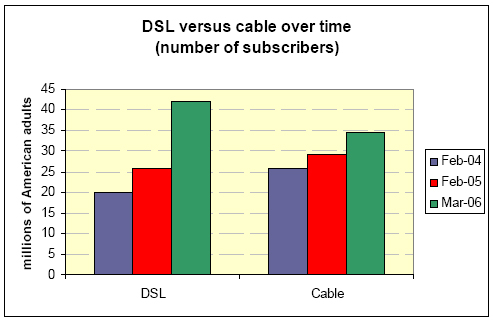
Both cable and DSL have been gaining subscribers over the past several years, but DSL has clearly been gaining subscribers at a faster rate than cable. DSL has gained most of the fastest growing segment of the market – the middle to lower-middle income group. Within that group, whose home broadband adoption rate grew by 59% from 2005 to 2006, 55% have DSL at home, while 35% have cable modems for their high-speed access at home.
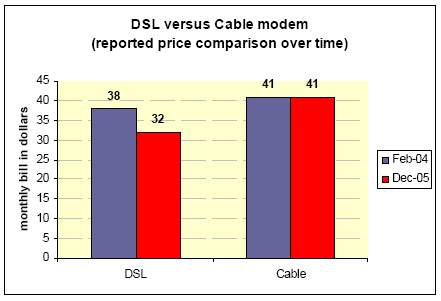
Fueled by dropping DSL prices, broadband is 8% cheaper than in 2004.
When asked what they pay monthly for their internet service, DSL users report, in our December 2005 survey, an average bill of $32; those with cable modem service report $41.8 This is a much larger price spread than was the case in February 2004, when we last asked this question. Then, DSL users said they paid $38 per month for home high-speed service compared for $41 per month that those with cable modem high-speed service reported paying. In other words, DSL was just a few bucks cheaper than cable modem service in 2004 – $3 to be exact. By the end of 2005, DSL service was $9 less expensive, on a monthly basis, than cable modem high-speed internet service.
For all types of connections, home broadband users report that they pay an average of $36 per month for their internet service. This compares with $39 per month that home high-speed users reported paying when we asked home high-speed users the same question in February 2004. That is a decrease in the monthly cost of broadband of about 8% over this time period.
For dial-up internet users, there has also been a change in what they pay for service. In December 2005, home dial-up users say their monthly bill for internet service was approximately $18, compared with $23 in February 2004. This represents a decline of 19%. The gap reported between the cost of high-speed and dial-up service at home did, however, grow somewhat, from $16 in 2004 to $18 by the end of 2005.
Most broadband users have some choice when it comes to service provider, though that is less true for rural Americans.
One would expect that users with the choice of more than one high-speed internet provider to benefit from the choice through lower prices. We asked respondents if they knew how many home broadband vendors provided service in their area. Fully 61% said that there is more than one high-speed internet provider available to them; 25% said “no,” with 13% responding that they did not know. This compares with 64% who said there was more than one high-speed provider in February 2004, 19% who said “no,” and 18% who did not know.
Looking at what people reported paying for service, respondents with more than one home high-speed service provider said they paid $36 monthly for service. Those who said they did not have more than one provider reported a monthly bill of $38. In February 2004, respondents with more than one home broadband provider said their monthly internet bill was $38; those who said they did not have more than one provider said they paid $43 per month for high-speed service.
Rural areas are the places with the highest incidence of having one high-speed service available to them. Among rural respondents, 35% said they did not have more than one high-speed provider available to them versus 24% of non-rural respondents who said this.
People are likely to cite the need for faster access speeds as the reason for upgrading to broadband.
The desire for a faster connection speed is the primary motivator for getting a high-speed connection at home. Nearly three-fifths (57%) of respondents specifically cited the need for faster access or greater connection speed when asked their reason for getting broadband. Several other categories of response indicate that the desire for more speed is an important factor: 6% said their dial-up connection was too slow and frustrating, 4% said they wanted to download files faster, and 2% cited entertainment as a reason. Few people mentioned price – 3% said the price of broadband fell to a more affordable level and 1% said they responded to a promotional offering.
In addition to the desire for speed, it is possible that having tasted high-speed connections at the work place, some users will be motivated to get it at home as well. That is true for one-third (33%) of users with broadband at home and work; they say that the high-speed connection had “a lot” to do with their decision to purchase the service for the home. Most (51%) said that high-speed at work did not affect their decision to get it at home.
When asked whether they know the connection speed of their home high-speed internet service, 81% of respondents said they didn’t know.
With speed looming large as a factor behind broadband adoption, we probed further to see how many broadband users were aware of the speed of their home connection. One reason for this is that companies increasingly draw comparisons of the connection speeds they offer to those of their competitors. Though connection speed clearly is important for broadband users, it is hard to pin them down on their precise connection speed. Just one in six (17%) were able to give a response as to what their home connection speed was, and 81% did not know or were not sure.
Some people are not interested in broadband at home.
With broadband adoption increasing apace in the United States and nifty online applications being developed that run best over fast connections, it may be hard to believe that many people would want to stick with their dial-up internet connections. However, when asked whether they would like to have high-speed at home, 39% of dial-up users say they would, and 60% say they are not interested in upgrading to broadband.
There are a couple of reasons for this apparent oddity. First, 22% of dial-up users who say they do not want to change to broadband at home have high-speed connections at work. Some of these home dial-up users may be content to surf the Web at a high-speed at work and take care of the basics – such as email – over their home dial-up connection.
Second, some demographic factors may come into play in keeping some people in the dial-up column. Age is a possible explanation; 46% of dial-up users who do not want broadband are over age 50, while 32% who want to get broadband are over age 50. In general, advancing age means less interest in power surfing online – which broadband enables. Income could also play a role. Dial-up users who say they do not plan to switch to broadband are more likely to have lower incomes than the average internet user; 45% of these users fall in the under $50,000 per year household income category compared with 40% of dial-up users who would like broadband.
Finally, it is worth noting that people’s preferences probably do not stay fixed over time. Roughly 40% of dial-up users have said they do want to switch to broadband when we have asked this question over the past four years; 40% of dial-up users said this in February 2004 and 38% said this in October 2002. However, the pool of dial-up users has shrunk markedly in this time frame – from 38% of all adults with dial-up connections at home in October 2002 to 22% in March 2006.
Even though many (40%) of dial-up users say they don’t want to switch to broadband, it is likely that some of these users will change their tune over time and decide to make the change to high-speed.
Although we do not have the same panel of respondents to identify changes in attitudes, the decrease in dial-up from 2002 to 2006 is undoubtedly due to many people who said they wanted to switch to broadband in fact making the switch. For the share of dial-up users who want to switch to broadband to stay steady at 40% – in the face of a declining pool of dial-up users – some dial-up users who said they did not want broadband in the past must shift over to the set of people who today say they want broadband.


