Introduction
The “digital divide” has been a concern of policy makers since the middle of the 1990s when the Internet emerged as a major communications medium and information utility. Anxiety about the divide centers on arguments that those who do not have access to the Internet are disadvantaged compared to Internet users for a number of reasons. The concern is that Internet non-users will have, among other things, less power as consumers and fewer economic opportunities, less access to high-quality health information, fewer options for dealing with government agencies, no chance to learn about their world from the millions of organizations and learning centers that have posted their material on the Web, and less opportunity to interact with others through email and instant messaging.
To respond to the continuing discussion in public policy circles, inside the technology community, and among social justice advocates, the Pew Internet Project has conducted several surveys to probe the reasons why people do not use the Internet. We explored these issues in a special survey between March 1 and May 19, 2002 that followed a similar exploration in the spring of 2000. The results are reported here and they include material from focus groups we conducted with non-users and Internet newcomers.
We have found that the U.S. Internet population has grown across the board since our first major survey about the digital divide in April 2000. At that time, 49% of American adults had Internet access. In the survey in the spring of 2002, 58% of Americans adults reported using the Internet. Between mid-2000 and mid-2002, every demographic group gained ground in access. As the size of the U.S. Internet population changed, the distance among some of the different population groups has narrowed. Still, for the majority of demographic groups, the size of the gaps between them has remained the same since our last survey. And it should also be noted that our tracking data have found that the growth of the Internet user population has slowed if not stalled since late 2001.
Overall, 42% of Americans do not use the Internet. And there remain clear differences along five demographic dimensions: race, income, educational attainment, community type (rural, suburban, or urban) and age. Whites are more likely to have access than African-Americans. Well-to-do families are more likely to have access than less well-off families. People with college degrees are more likely to be online than those who have high school diplomas. Those who live in suburban and urban areas are more likely to have Internet access than those who live in rural areas. And those who are young are much more likely than those who are old to be online.
Demographically, the composition of the not online population has not changed dramatically since a Pew Internet & American Life Project survey devoted to the digital divide in April 2000. Here is a snapshot of those who do not use the Internet:
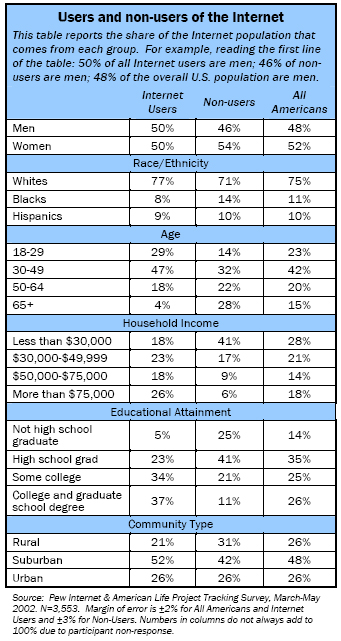
A greater percentage of African-Americans are not online than whites. Hispanics are gaining steadily.
When we surveyed in March-May 2002, 40% of whites said they do not use the Internet, as did 55% of African-Americans and 46% of English-speaking3 Hispanics.4
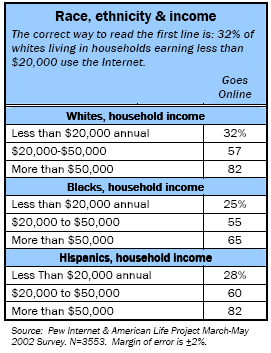
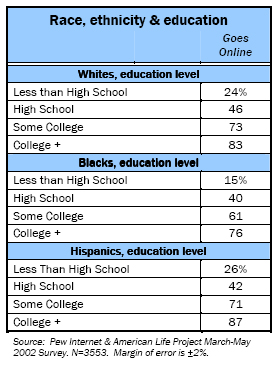
Even at equivalent income levels, African-Americans are less likely than either whites or English-speaking Hispanics to go online. Among those earning less than $20,000 a year, 32% of whites are online, compared to 28% of English-speaking Hispanics and 24% of African-Americans. Even in the upper income levels, the gap remains. Of whites who live in households earning $50,000 or more a year, 82% go online. By comparison, 65% of African-Americans who live in households earning $50,000 or more a year go online, as do 82% of English-speaking Hispanics. Education level tells a similar story. Whites’ and Hispanics’ online populations are 6 to 12 points larger than African-Americans with similar education levels.
The Pew Internet Project applied a number of statistical techniques to the data to determine the degree to which race stands out as an independent variable for using the Internet. This was done as a part of a test to investigate whether specific factors might independently account for the gaps in Internet use among different groups.
Several demographic factors are strong predictors of Internet use.
Several demographic factors are strong predictors of Internet use: having a college degree, being a student, being white, being employed, and having a comfortable household income. Each of those factors independently predicts Internet use. Notably, gender is not a significant factor. As for race, being white is a strong predictor of whether a person is online, controlling for all the other demographic variables in the model. In a model with blacks and Hispanics as the race variable, being black or Hispanic was a negative predictor of Internet use. In sum, race and ethnic origin matter. Holding all other factors constant, blacks and Hispanics are less likely to go online than whites.5
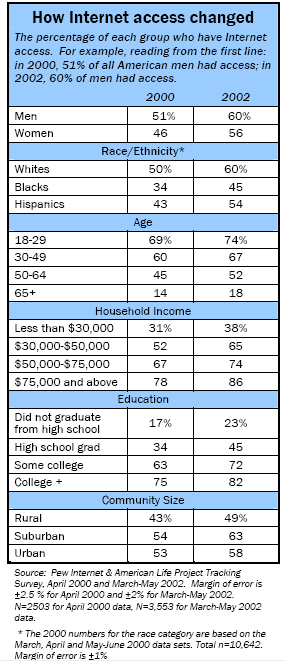
Lower income. While there has been growth in all income segments, those who have the furthest to go have not gained ground on those in higher income brackets. The current number of users who live in households earning less than $30,000 reflects a 7-point increase in Internet users from our survey in 2000, while the upper income brackets sustained that level of increase or greater in percentage points. Independent of all other factors, having an income above $50,000 annually predicts Internet use.
Lower education levels. Non-users still report lower levels of educational attainment than Internet users. A quarter of non-users do not have a high school diploma, versus 5% of Internet users. And 11% of non-users have a college education, as do more than a third (36%) of Internet users. In our statistical models, a high level of education, and student status, were shown to be the strongest independent predictors of Internet use.
Older. The grey gap persists. Half of all non-users are over 50. Some 28% of non-users are 65 and older while just 14% of non-users are 18 to 29. Americans in the middle of their lives (30-64) are the age groups whose online populations grew the most. Younger Americans show relatively low levels of growth reflecting the saturation from previously high levels of Internet access in that group. That is a reflection of their already-high level of Internet use. It is hard to grow at a high rate when so many young Americans are already online. On the other hand there is little growth among seniors.
Rural and Southern. Disparities between rural inhabitants and others remain, while suburbanites have moved ahead of their urban counterparts in Internet penetration. In rural areas, less than half of Americans go online. Southerners are the least likely of any geographic group to be online with 45% still not using the Internet, closely followed by the Midwest with 44% offline. The Northeast has 41% of its population offline and the West continues to lead in Internet penetration – only 37% of Westerners do not use the Internet.
Not employed. Non-Internet users are much more likely than those who use the Internet to be retired, not employed, or disabled. All three factors closely track with greater age. Twenty-nine percent of non-users are retired, versus 7% of Internet users. Sixteen percent of non-users are not employed for pay, compared to 12% of Internet users.
Disabled. Non-users are much more likely to be disabled than Internet users – 26% of non-users report a disability, compared to 12% of Internet users. Twenty-eight percent of the not-online disabled say their disability makes it difficult or impossible to use the Internet.


