Note: For an April 2023 look at who pays income tax, read “Who pays, and doesn’t pay, federal income taxes in the U.S.?”
As Congress and the White House pivot from trying to repeal the Affordable Care Act to overhauling the U.S. tax code, it’s helpful to take a closer look at how the tax system works presently in the context of its recent history.
Individual income taxes are the federal government’s single biggest revenue source. In fiscal year 2017, which ended Sept. 30, the individual income tax was expected to bring in nearly $1.66 trillion, or about 48% of all federal revenues, according to the Office of Management and Budget. The corporate income tax was estimated to raise another $324 billion, or 9% of total federal revenue.
The rest of the federal government’s revenue comes from a mix of sources, including Social Security and Medicare payroll taxes, excise taxes such as those on alcohol and gasoline, unemployment-insurance taxes, customs duties and estate taxes. Spending that’s not covered by taxes is paid for by borrowing.
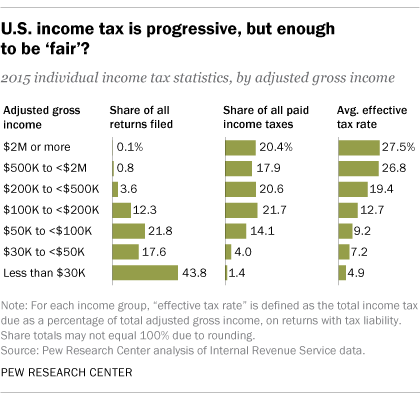
The individual income tax is designed to be progressive – those with higher incomes pay at higher rates. A Pew Research Center analysis of IRS data from 2015, the most recent available, shows that taxpayers with incomes of $200,000 or more paid well over half (58.8%) of federal income taxes, though they accounted for only 4.5% of all returns filed (6.8% of all taxable returns).
By contrast, taxpayers with incomes below $30,000 filed nearly 44% of all returns but paid just 1.4% of all federal income tax – in fact, two-thirds of the nearly 66 million returns filed by people in that lowest income tier owed no tax at all. (The IRS tax data used here are estimates based on a stratified probability sample of all returns.)
Nearly all income tiers above $100,000 paid higher shares of total income tax in 2015 than they did in 2000 (though the shares for many high-income groups fell in the early 2000s, following enactment of major tax cuts in 2001 and 2003). For example, the $2 million-and-higher group paid 20.4% of all tax in 2015, up from 17.2% in 2000. The share for the $200,000-to-under-$500,000 group rose to 20.6% from 14.9%. Some of those shifts may be due to changes in the tax laws or to what’s known as “bracket creep” – the phenomenon in which inflation pushes people into higher tax brackets.
Effective tax rates – calculated as the total income tax owed divided by adjusted gross income – also rise with income. On average, taxpayers making less than $30,000 paid an effective rate of 4.9% in 2015, compared with 9.2% for those making between $50,000 and under $100,000 and 27.5% for those with incomes of $2 million or more.
But the system starts to lose its progressivity at the very highest levels: In 2015, the effective rate peaked at 29.3% for taxpayers in the $2 million-to-under-$5 million group, then fell to 28.8% for the $5 million-to-under-$10 million group and 25.9% for those making $10 million or more.
Generally speaking, effective tax rates fell across the board throughout most of the 2000s, though the highest-income tiers experienced the steepest drops. Effective rates on those same groups rose sharply, however, following enactment of the American Taxpayer Relief Act of 2012. That law, part of the congressional deal that resolved the 2012-13 “fiscal cliff,” undid many of the George W. Bush-era tax cuts for upper-income taxpayers while retaining them for middle- and lower-income people.
In the current overhaul effort, President Donald Trump and congressional Republicans both have made lowering corporate income taxes a top priority. But despite the 35% statutory rate on corporate profits – broadly defined as revenue less costs of doing business – most corporations pay considerably less, due to various deductions, credits and other special tax provisions.
In 2013 (the most recent year for which corporate tax data are available), the 3.6 million corporations that reported net income on their returns owed corporate income tax equal to 15.2% of their total pretax profits after all credits were applied, according to our analysis of IRS data. As recently as 2001, the effective corporate tax rate was 27.6%. (However, a Congressional Budget Office report noted that even using the effective rate, U.S. corporate taxes in 2012 were still the fourth-highest among G-20 countries.)
[that]
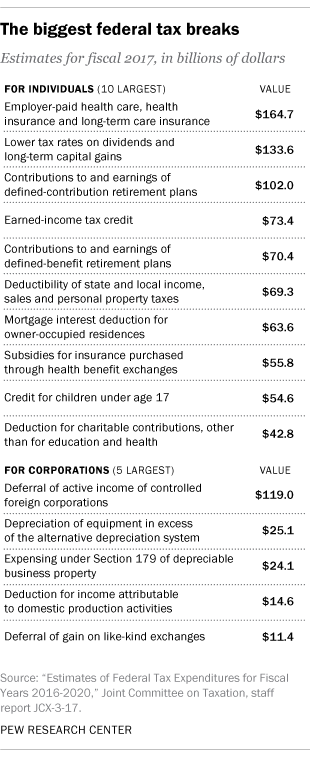
More than 80% of the tax breaks identified by the Joint Committee go to individual taxpayers. The mortgage-interest deduction, for instance, was valued at $63.6 billion, while the deductions for individual charitable contributions of all kinds cost the government $56.9 billion. The child tax credit, which the GOP framework proposes increasing, was worth an estimated $54.6 billion in fiscal 2017. But ending the deductibility of state and local taxes, as some Republicans in Congress have proposed, would be a big hit to many individual taxpayers who itemize: That deduction was estimated to be worth $69.3 billion last year.
Related posts:
Among developed nations, Americans’ tax bills are below average
More Americans favor raising than lowering tax rates on corporations, high household incomes