There are any number of ways to assess the public’s approach to facts and information. One method could involve case studies or experiments to test how people respond to specific information-evaluation challenges. Another might attempt an in-depth assessment of a specific event and research how people learned about it and reacted to it.
In this study, Pew Research Center aimed to study broad patterns in people’s approach to information and report on a spectrum of engagement among Americans ranging from relatively high enthusiasm to relatively deep wariness. The information-user typology here was built around analyzing five batches of questions in the survey: First, it assessed people’s level of interest in some key news and information subjects. Second, it captured their trust in various information sources. Third, it explored areas where people are interested in learning and growing. Fourth, it probed aspects of their lifestyle that might tie to their ability to spend time with information. And fifth, it explored people’s technology assets.
This chapter runs through people’s answers to those questions and how they fit together in the typology.
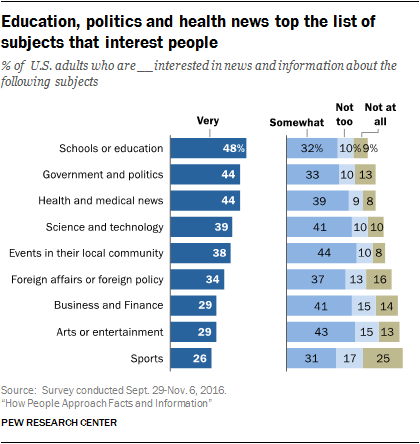
1) Interest in key news and information topics
The questions covered people’s level of interest across nine different topics. A majority are relatively interested in each of the different categories, with education, politics, and health and medical news among the topmost subjects that interest people.
For the purposes of the typology, the model was built using the mean (average) number of topics that people said they are “very” interested in. The Eager and Willing said they are very interested in 4.47 topics; the Confident are very interested in 3.48; the Cautious and Curious are very interested in 3.45 of these topics; the Doubtful are very interested in 3.08 of them; and the Wary are very interested in 2.32.
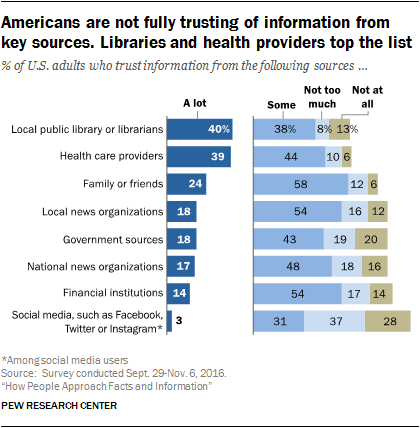
2) Trust in information sources
Beyond people’s interest in topics, the survey looked at people’s trust in eight information sources. Libraries and health care providers top the list of the most trusted sources that were queried, while social media is at the bottom.
Overall, 30% of American adults say they do not trust any information source on our list “a lot.” On average, American adults trust 1.7 of the eight sources “a lot.”
The typology used the mean number of these sources that people trust a lot. The figure is 3.43 for the Confident; 3.05 for the Eager and Willing; 1.07 for the Cautious and Curious; .90 for the Doubtful; and .61 for the Wary.
3) Learning outlook and interest
People’s engagement with information can be tied to their interest in learning more. Several of this survey’s questions borrowed from the analytical insights tied to whether people have a growth mindset or fixed mindset, developed by Stanford psychology professor Carol Dweck. Growth mindset refers to people’s attitudes about whether human beings are essentially fixed in their basic talents and traits, or whether they have the capacity to grow.
One question asked for people’s views about this statement: “Music talent can be developed by anyone.” Some 28% say this statement describes them “very well,” and the variance among the groups on this answer was a meaningful input to the model.
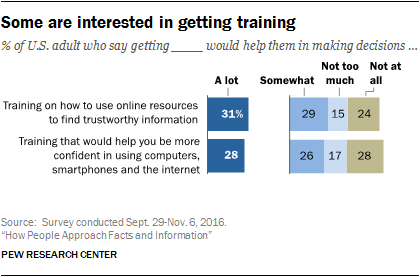
Another question asked whether people think that training on how to use online resources for finding trustworthy information would help them in making decisions. Some 31% said that would help their ability to make decisions “a lot.” Again, there was notable variation among different groups around this answer.
The third personal growth question dealt with the degree to which people thought they might be helped in making decisions if they got training aimed at making them more confident in using digital technology. Some 28% of adults said such training would contribute “a lot” to their decision-making capacity. And those answers varied across the groups.
In all, 53% of Americans gave the strongest affirmative answer to at least one of these questions, and this became a useful predictor in helping establish which group people belonged in.
4) Lifestyle issues
Additionally, the survey sought insights about time pressures and other stresses in people’s lives that might tie to their ability and interest to engage with information. First, 39% of internet users (35% of all adults) say they “occasionally” or “frequently” could use help finding the information they need online. These answers were strikingly different across the various typology groups. Second, 52% of Americans say this statement describes them very well: “I’m usually trying to do two or more things at once.” Third, 37% of adults say this statement describes them very well: “Trying new things is stressful for me.” Fourth, 41% of the public says “I am usually patient when I have to wait in line doing day-to-day errands” describes them very well. Again, there was notable variance across the different groups in the way people answered these questions.
5) Digital access tools
Finally, the survey covered the basic technology inventory of people’s lives and found that three kinds of tools and access mattered to the typology. In this survey, 77% of respondents have a smartphone; 73% have a home broadband subscription; and 51% have a tablet computer. Some 42% of adults have all three, and we think of this as “access abundance.” Statistical modeling showed those with such abundance had different engagement compared with those who two or fewer of those access tools.
Cluster analysis yields the typology
A statistical technique called cluster analysis yielded the five groups this report discusses. The technique places people into distinct categories based on the similarity of their answers to specific survey questions. Unlike many other statistical techniques, cluster analysis does not result in a single “correct” result. Instead, researchers run numerous versions of it – that is, by asking statistical software to produce different numbers of clusters. They then judge each result by how analytically practical and substantively meaningful it is. Nearly every version researchers tried for this report had a great deal in common with the others, giving us strong confidence in the comparative shares of those who were relatively information engaged and information wary.


