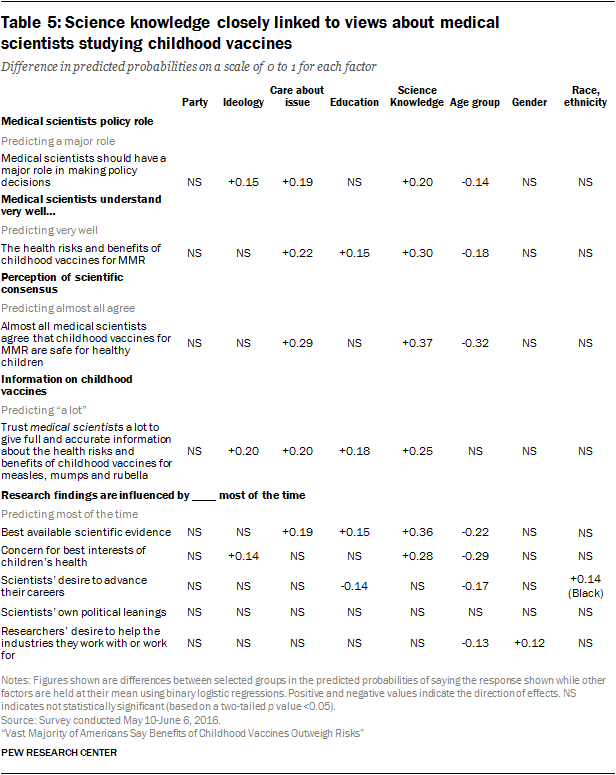
The following tables detail the results of a series of statistical models predicting people’s beliefs about the measles, mumps and rubella vaccine, their views about a school-based requirement for the MMR vaccine and their views of medical scientists associated with childhood vaccines from a set of explanatory variables.
The regression analyses using a binary logistic model are based on the full sample of U.S. adults in the survey. The analyses are based on the weighted sample, thus adjusting for differences in the probability of selection and nonresponse differences across groups. Results are based on 0.05 level of statistical significance. The dependent variable omits respondents who gave no response to that question.
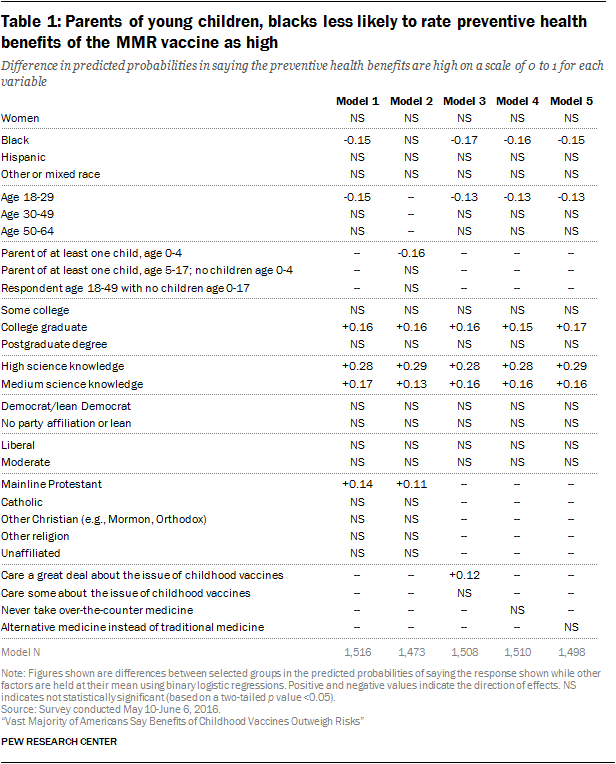
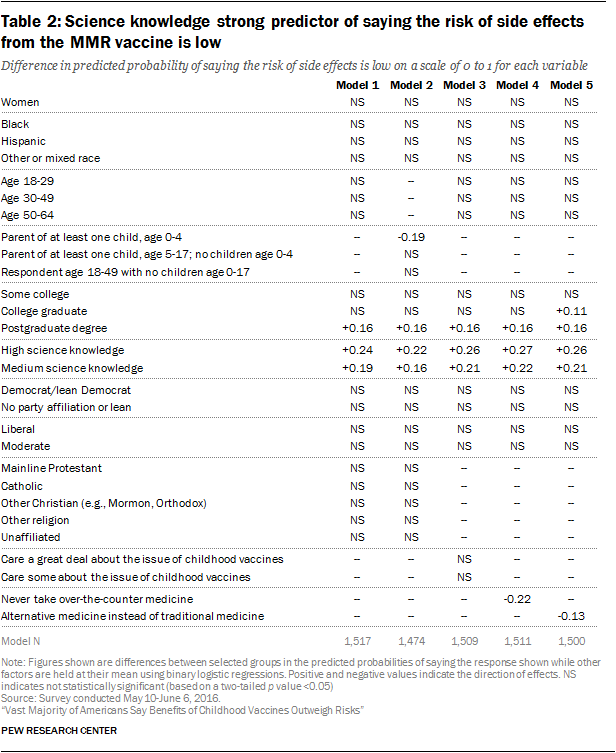
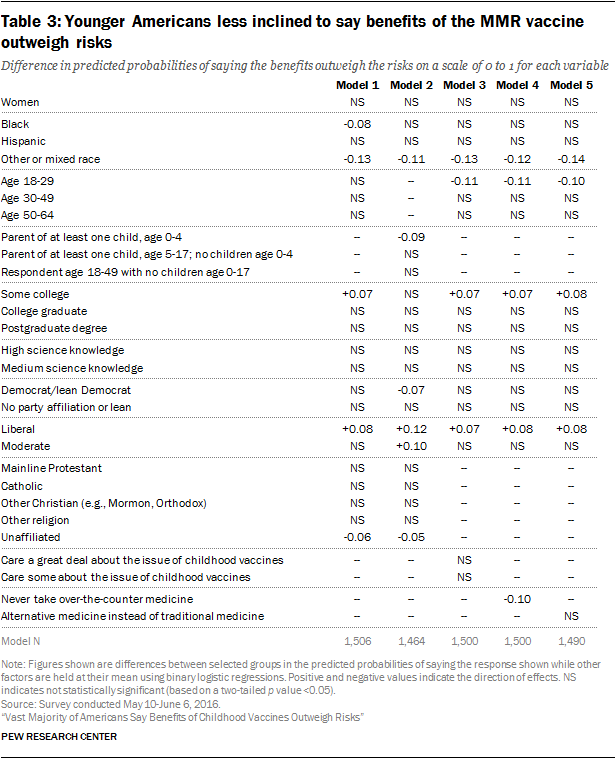
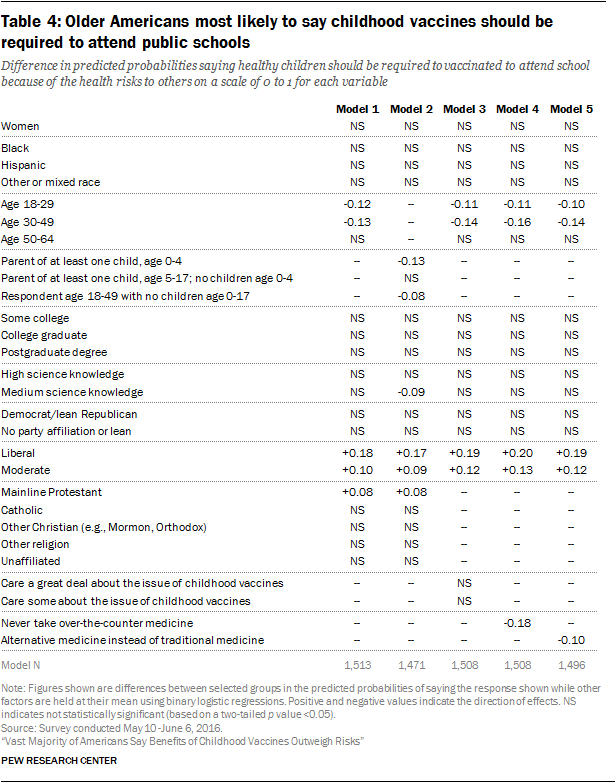
Five separate statistical models are shown that predict people’s beliefs about the MMR vaccine and their views on a school-based requirement. The tables show the degree to which the predictors of beliefs are consistent across models using different sets of independent variables. Where independent predictors have a strong conceptual overlap, such as the use of alternative medicine with the use of over-the-counter medicines, only one such predictor is included in each statistical model.
Each figure in the tables shows the difference in predicted probability between two categories if that independent variable is a statistically significant predictor of attitudes. For example, in the first column of Table 1 (Model 1), an individual with high science knowledge is 28 percent more likely to say the preventive health benefits of the MMR vaccine are high than is an individual with low science knowledge, holding the other variables at their means. And in the same table and column (Model 1), a black (non-Hispanic) person is predicted to be 15 percent less likely than a white (non-Hispanic) person to say the preventive health benefits of the MMR vaccine are high, holding the other variables at their means.
The independent variables included in these analyses are as follows: gender (women compared with men); race and ethnicity (non-Hispanic blacks, Hispanics and other or mixed race as compared with non-Hispanic whites) age (ages 18-29, 30-49, 50-64 as compared with those ages 65 and older); parent status (parent of at least one child age 0-4, parent of at least one child ages 5-17 but no children ages 0-4, respondent age 18-49 with no children ages 0-17 as compared with respondents ages 50 and older with no children ages 0-17); education (having a postgraduate degree, college degree or some college as compared with those having a high school diploma or less education); science knowledge (those with a high or medium knowledge level as compared with a low knowledge level based on a nine-item index); party affiliation (Democrats and independent-leaning Democrats, those with no party affiliation or leaning toward either party as compared with Republicans and independent-leaning Republicans); political ideology (liberals, moderates as compared with conservatives); care about the issue of childhood vaccines (care a great deal, care some compared with care not too much or not at all); take over-the-counter medication for cold or flu symptoms (never use compared with those who use when symptoms worsen or right away); used alternative medicine (instead of “traditional” medicine compared with those who have used in addition to conventional medicine or have never used alternative medicine).17
The total number of respondents in each analysis ranges between roughly 1,464 and a possible maximum of 1,549 respondents, depending on the number of missing responses to an independent variable in the model or to the dependent variable.