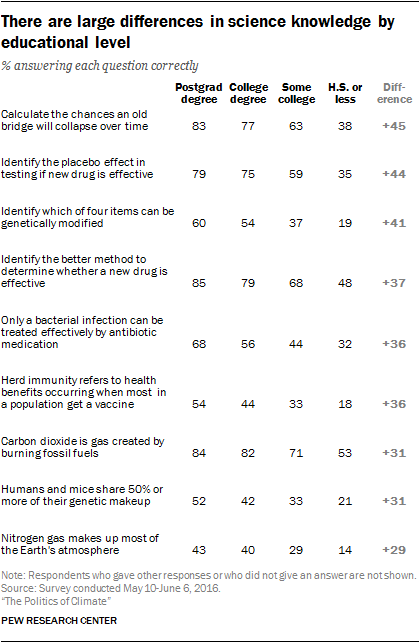
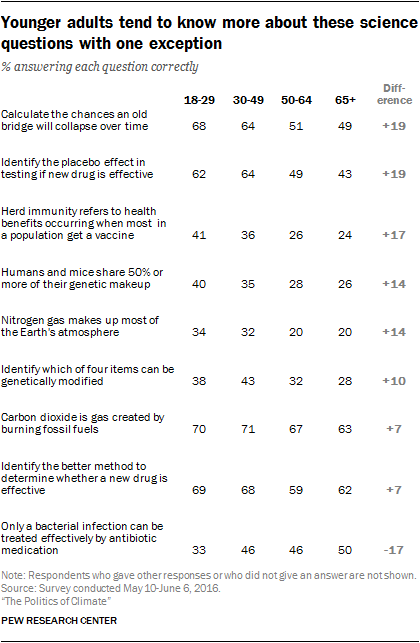
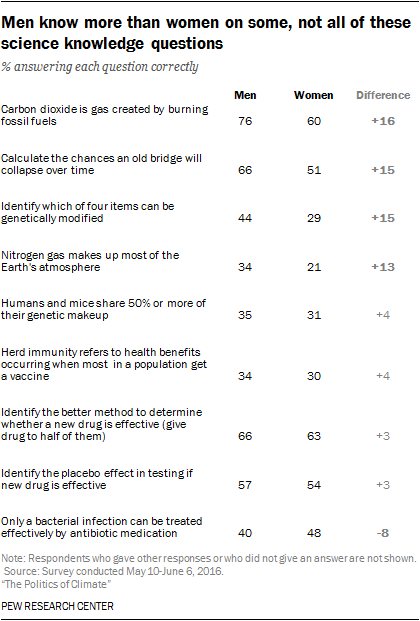
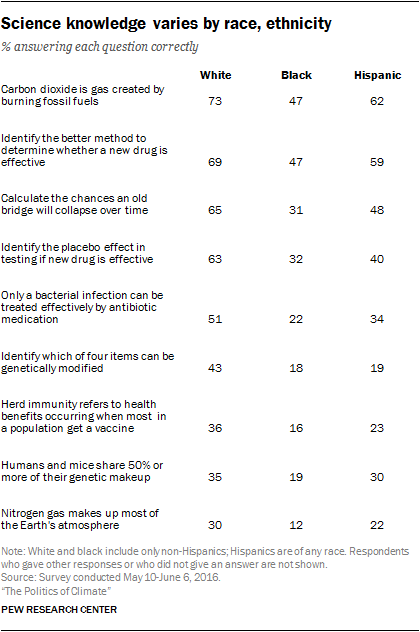
The following tables detail public knowledge about science by education, age, gender, race and ethnicity for each of the nine questions in the science knowledge index.
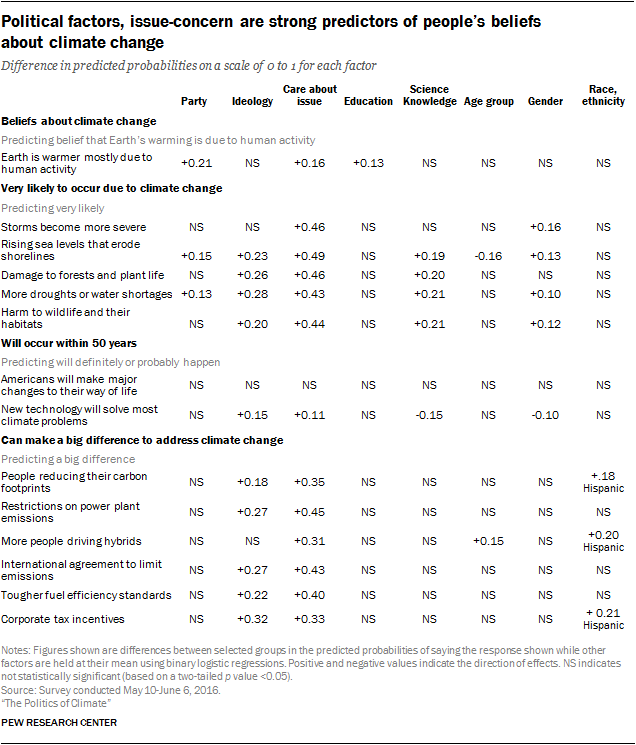
These tables are followed by summary statistics showing the results of a series of statistical models predicting people’s beliefs about climate change and their views of climate scientists from a set of explanatory or independent variables.
The regression analyses using a binary logistic model are based on the full sample of U.S. adults in the survey. The analysis is based on the weighted sample, thus adjusting for differences in the probability of selection and nonresponse differences across groups. Results are based on 0.05 level of statistical significance. The dependent variable omits respondents who gave no response to that question.
The independent variables used in each analysis are as follows: party affiliation (Democrats and leaning Democrats, those with no affiliation or leaning toward either party as compared with Republicans and leaning Republicans); political ideology (liberals, moderates as compared with conservatives); education (having a postgraduate degree, college degree or some college as compared with those having high school degrees or less education); science knowledge (those with a high or medium knowledge level as compared with those have a low knowledge level based on the nine-item index); age (ages 18-29, 30-49, 50-64 as compared with those ages 65 and older); gender (women compared with men); race and ethnicity (non-Hispanic blacks, Hispanics and other or mixed race as compared with non-Hispanic whites).21
The total number of respondents in each analysis ranges between roughly 1479 to a possible maximum of 1,534 respondents, depending on the number of respondents missing responses to either an independent variable in the model or to the dependent variable.
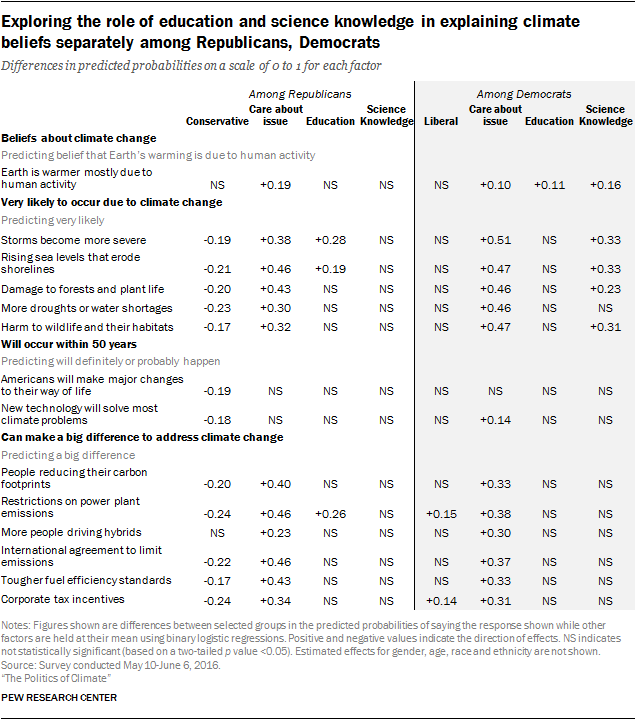
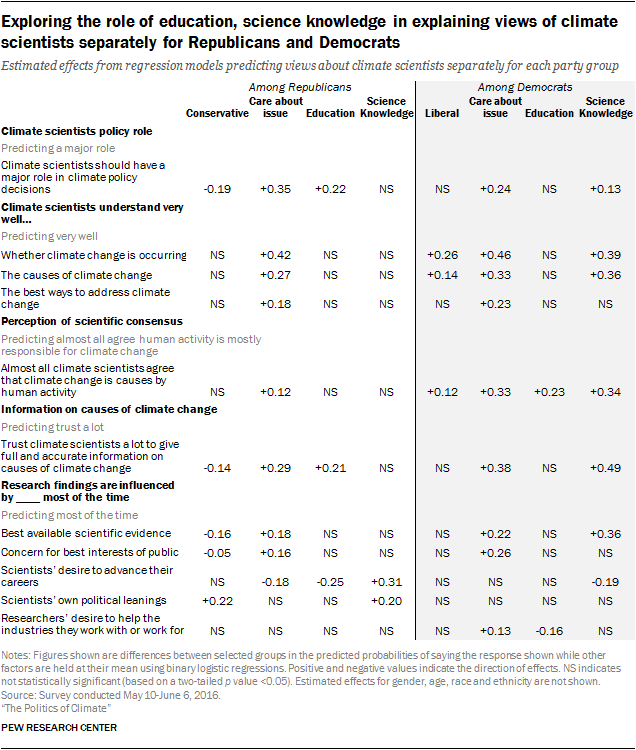
A separate set of analyses tested the effect of science knowledge separately among Republicans (and independents who identify with the Republican Party) and Democrats (and independents who identify with the Democratic Party). These analyses are conducted with roughly 635 to a maximum of 661 Republicans and 808 to a maximum of 828 Democrats. 22