Medium engagement groups make up almost 40% of the overall U.S. population, and often mirror the general population in their habits, views, and demographics. This is especially true of the larger of the two groups, the Solid Center, who make up 30% of Americans ages 16 and older. The other medium engagement group, Print Traditionalists, comprises about 9% of the U.S. population.

Though they tend to be middle-of-the-road in most measures, both of these medium engagement groups are useful in understanding the quiet foundation of public library support in America.
One of the most striking differences between the two high engagement groups and two medium engagement groups is the degree to which they have basic connections to libraries. For instance, almost six in ten members of these medium engagement groups have library cards, roughly in line with the rate for the general population—but notably lower than the high engagement groups. Some 43% of those in the Solid Center and 48% of Print Traditionalists visited the library in the previous 12 months, though few of those recent visitors did so more than once a month. Both groups have typical rates of technology usage, and few members of either group make frequent use of library websites—though Print Traditionalists (20%) are more likely to have used a library website in the past year than those in the Solid Center (5%).
One difference in the two groups’ library usage is that Print Traditionalists, who are far more rural than those in the Solid Center, tend to live farther from public libraries—just 11% say they live within 5 miles of the nearest library. They are also more likely to indicate there are barriers to their library use: Though 62% of all Americans ages 16 and older say it would be “very easy” to visit a public library in person, this is true for only 46% of Print Traditionalists (but 69% of the Solid Center).

Additionally, while both groups view libraries positively and place a high value on libraries’ roles in their communities, members of the Solid Center are less likely to say they would be personally impacted by the closing of their local public library. Print Traditionalists are actually more likely to say they and their families rely on various library services, and that the closing of their local public library would have a major personal impact.
The groups also differ somewhat in their demographic make-up:
- Members of the Solid Center generally fall in the middle of the road on all demographic and lifestyle measures, but do include slightly higher proportions of men and older adults compared with the general population; they are also slightly more likely to live in higher income households, and to be politically conservative.
- Meanwhile, Print Traditionalists include a higher proportion of women, and are less likely to have graduated college (about half of adults in this groups have at most a high school education). They are also somewhat more likely to live in lower income households. They are more likely than other groups to be white, while the Solid Center tend to match the general U.S. population on measures of race and ethnicity.
Solid Center
Overview
The Solid Center is the largest group in the spectrum of public library users, representing more than a third of them. From their demographic composition to technology use to perceptions of libraries, they generally reflect the circumstances and habits of the overall U.S. population.
Those in the Solid Center appreciate libraries, but a third of them—32%—say their use of libraries has declined in the past five years. They appreciate libraries as a community resource, but do not view them as an essential personal resource: A majority say that the closing of the local library would have a major impact on their community, but they are significantly less likely than Print Traditionalists to say the loss of the local library would have a major impact on them personally.
The members of the Solid Center cohort feel confident they can get crucial information if they want it. They like having lots of information and do not feel overloaded, and are medium-scale book readers and news consumers. They say they would find it easy to find information about politics and current events, what’s happening in their community, health matters, and career opportunities. However, many of them do not necessarily think of the public library as a go-to resource to the same extent as higher engagement groups such as Library Lovers and Information Omnivores.
Who they are
Demographics
Demographically, the Solid Center group can be understood as a microcosm of America. As such, their demographic makeup looks broadly like the country as a whole, with only slight variations. For instance, they are a bit more like to be male than the general population (51% are male, 49% are female), and they are slightly older than the general population, with a median age of 47. However, racially and ethnically, this group’s makeup is very similar to the U.S. as a whole: 66% are white, 12% are black, and 14% are Hispanic. (In this, members of the Solid Center differ from Print Traditionalists, who are disproportionately white.)
Continuing their “center-ness,” those in this group are married, partnered, singles, divorced, and widowed in the same proportion as the whole population. Some 28% are currently parents of minor children, considerably below the level of the High Engagement groups, but above the level of the Low Engagement groups. And the children of parents in the Solid Center are almost as likely to have visited the library as those in the general population.
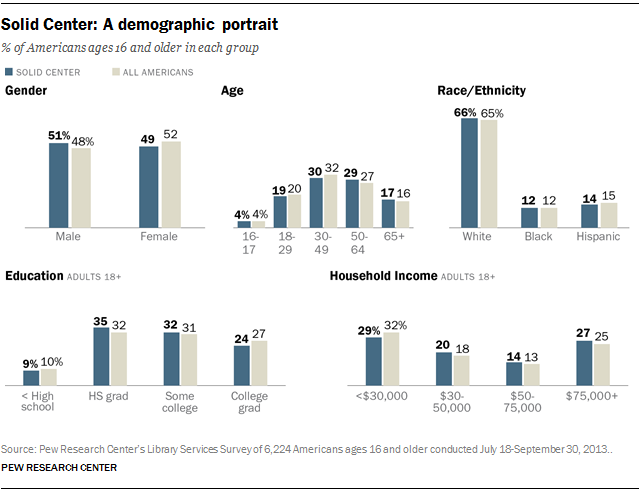
Members of the Solid Center have educational levels that closely map the general adult population in the United States: 9% never graduated from high school; 35% ended their education with a high school diploma; 32% have taken some college courses but have no degree; 24% are college graduates.
Economically, the Solid Center are in the middle of the pack: 46% have full time jobs; 13% have part-time jobs; 18% are retired; 16% are not employed for pay; 2% have their own businesses. Some 19% are looking for jobs, the same number as are seeking work in the full population; and 17% are students. Similarly, they map with the income profile of the country as 29% of adults live in households earning less than $30,000; 20% live in households earning $30,000-$49,999; 14% live in households earning between $50,000 and $74,999; and 27% live in households earning $75,000 or more. Compared with Print Traditionalists, those in the Solid Center are more likely to live in higher-income households and less likely to live in lower-income households.
Other lifestyle notes
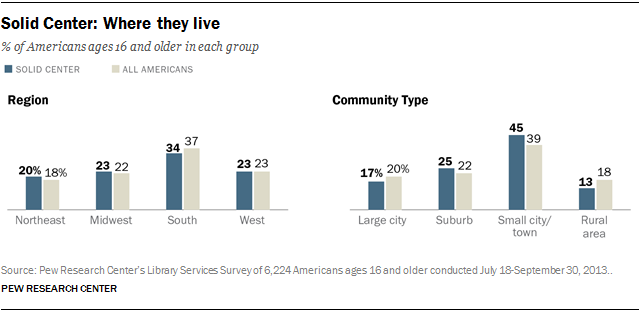
By being in the middle, Solid Center members are quite different from the other medium engagement group, Print Traditionalists, who are heavily concentrated in rural areas; those in the Solid Center are more evenly distributed throughout various kinds of communities.
Half of those in the Solid Center have lived in their communities for longer than 10 years, and they are generally happy with their communities: 84% rate them as “good” or “excellent.” At the same time, they are a bit less likely than Print Traditionalists to say they feel that people like them can have a big impact in making their community a better place to live (28% versus 34%). They are also less likely than Print Traditionalists to say they know all their neighbors (27% versus 35%).
Politically, the Solid Center mirrors the partisanship and ideological distribution in the country: 23% are Republican; 32% are Democrats; 36% are independents. Some 37% of Solid Center members say they are conservative, 35% say they are moderate, and 21% say they are liberals.

In community engagement measures, those in the Solid Center are not quite as likely to be regularly engaged in certain activities as those in the high engagement groups, but they are relatively active: 34% attend sporting events regularly, 28% regularly visit bookstores, 27% go to concerts, plays, or dance performances (significantly higher proportions than among Print Traditionalists), and 26% say they frequent museums or art galleries.
Technology and information habits
The Solid Center group’s technology-adoption profile is similar to that of the general population.

They differ somewhat from Print Traditionalists because they are more likely to have a smartphone (57% versus 47%), more likely to have a tablet computer (35% versus 29%), and more likely to use a mobile device to connect to the internet (69% versus 63%).
Defining information traits
Those in the Solid Center have information practices and attitudes that do not vary much from the overall population, or even from their medium engagement counterparts among the Print Traditionalists. They enjoy learning new things generally feel self-sufficient in getting some of the information they need, though they also say they would be more likely than not to ask for help doing more complicated information activities such as applying for government services or benefits, starting a business, and filing their taxes.
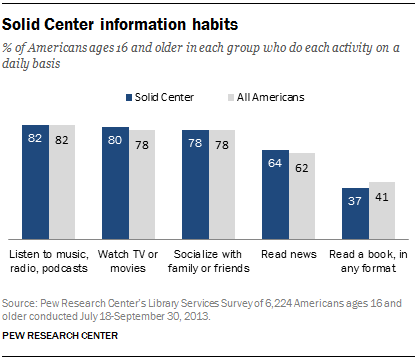
They listen to music, watch television, read newspapers and read books at frequencies very close to the U.S. population as a whole. Some 57% of them say they enjoy keeping up with the news “a lot,” more than most other groups.
As a group, in the past 12 months, they have read an average of 11 books and a median of five books (half of them have read more than five and half of them have read less than five). Some 28% of them regularly go to bookstores, and 56% say they tend to purchase books rather than borrowing them.

Relationship to public libraries
One of the most striking differences between the high engagement groups and the medium engagement groups is the degree to which they have basic connections to libraries. As such, those in the Solid Center are less likely than those in the high engagement groups to have library cards or to have visited the library or a library website in the past 12 months.
Notably, 32% of Solid Center members say their library use has gone down in the past five years. At the same time, 98% report the library is easy for them to get to, and the vast majority live within five miles of a branch. Among those who have visited a library at some point, 94% report it is easy to find what they want when they do visit. They also feel pretty familiar with the services and programs their libraries offer.
Those in the Solid Center are more likely than Print Traditionalists to agree that people do not need libraries as much as they used to because they can find most information on their own (67% agree with that versus 47% of Print Traditionalists).
Public library use and experiences
Here are some of the key benchmarks of how members of the Solid Center connect with libraries:
- 58% have a library card.
- 43% have visited the library in the last 12 months; 44% of those recent visitors go to the library at least once a month, and 55% go less frequently.
- Only 5% used a library website in the past 12 months.
- They are more likely than some other groups to say their library use is decreasing (32%).
This more moderate engagement with libraries compared with higher engagement groups also carries over to the lives of their children: Some 64% of Solid Center parents say their children have used a library in the past 12 months, compared with 70% of all parents in the United States.
Public library attitudes
Like the overall population, those in the Solid Center express appreciation for libraries and their role in the community across a range of measures. They generally know a fair amount about their local public library, and tend to rate libraries highly overall.


However, though they think that libraries are very important to their communities—67% say that libraries improve the quality of life in a community, and 61% say that their library’s closing would have a major impact on their community as a whole—they tend to value libraries more for their neighbors’ sakes than their own. They are less likely to say the loss of the local library would have a major impact on them personally, and are less likely to rely on different library services.


Print Traditionalists
Overview
Print Traditionalists represent a modest, specific slice of the U.S. population (about 9% of Americans ages 16 and older.) Though they value libraries, both personally and for their communities, they don’t always have a lot of personal interaction with their local library: Among recent library visitors, only 5% say they visit at least once a week, and most visit either monthly (47%) or less often (48%). Though their library habits are generally similar to those of the Solid Center, Print Traditionalists are much more likely to live in rural areas, and the vast majority say the nearest public library is at least five miles away.
However, they are just as likely as the general population to say their household relies on various individual library services. We have called them Print Traditionalists because they are one of the higher-ranking groups when it comes to valuing the traditional services libraries perform. They value libraries as an important resource—both for themselves and for their communities—even though libraries aren’t necessarily a part of their daily lives.
Unlike their medium engagement counterparts in the Solid Center, Print Traditionalists differ demographically from the general population in several ways. They are more likely to be women, for instance, and are more likely to be white. They are also somewhat more likely to live in lower income households, and are less likely to have graduated college—about half of adults in this groups have at most a high school education.
Finally, Print Traditionalists tend to have lower levels of technology use than some other groups, though most use the internet, own cell phones, and use social networking sites. The overall contours of their reading habits are similar to those of the general population, and they are generally comfortable finding various types of information.
Who they are
Demographics
Print Traditionalists include a higher proportion of women ( 57%) compared with the U.S. population as a whole. They are less likely to have graduated college, as about half (51%) of adults in this groups have at most a high school education. They are also somewhat more likely to live in lower income households.

Demographically, one of the largest differences between Print Traditionalists and the general U.S. population is that they are more likely to be white: 75% of Print Traditionalists are white, a higher proportion than almost any other group.
Other lifestyle notes
About half (50%) of Print Traditionalists live in in the south, and 61% say they would describe the place where they live as a rural area; just 2% say they live in a large city, compared with 20% of Americans as a whole.


Like those in the Solid Center, Print Traditionalists are more likely to have lived in their neighborhood longer than the two high engagement groups. They are especially likely to say they know the names of all or most of their neighbors, and tend to have positive feelings about where they live. Print Traditionalists are also quite social: 81% say they socialize with friends or family every day or almost every day.
Politically, Print Traditionalists skew Republican (27%), and are more likely to identify as conservative (44%) than any other group.
Finally, Print Traditionalists are fairly typical in their activity levels in their communities. About a third (34%) of Print Traditionalists say they have attended a sporting event in the past year, similar to other high or medium engagement groups.
However, they are often less likely to visit bookstores, attend concerts, or visit museums than many other groups.
Technology and information habits
Print Traditionalists have fairly typical rates of technology use, but they are somewhat less intense users of the internet and social media services than many other groups.
Technology use
Print Traditionalists as a group have typical rates of internet use (87% go online, similar to the general U.S. population). However, those that do go online log on somewhat less often than other internet users: 74% of online Print Traditionalists say they use the internet every day, versus 82% of all internet users. Print Traditionalists are also less likely than some other groups to have internet access at home (85%).
Print Traditionalists are not averse to e-book reading devices: They are just as likely to own e-readers as Americans as a whole (24% own an e-reader like a Kindle or Nook), but just 29% own tablets (compared with 35% of Americans ages 16 and older).

Defining information traits
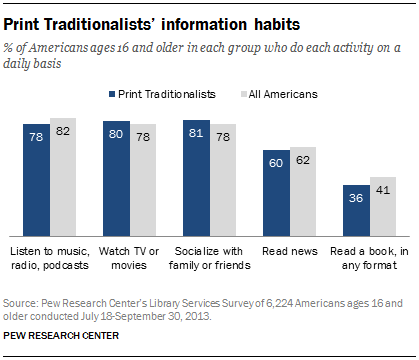
Print Traditionalists’ daily information habits are generally similar to those of the general population as a whole.
Like those in the Solid Center, Print Traditionalists are less likely to say they read books daily (36%) than high engagement groups. Print Traditionalists read an average of 13 books in the past year, and a median of 5. 6They are slightly less likely to go to bookstores regularly, though are just as likely to purchase (50%) or borrow (37%) most of the books they read as the national population.
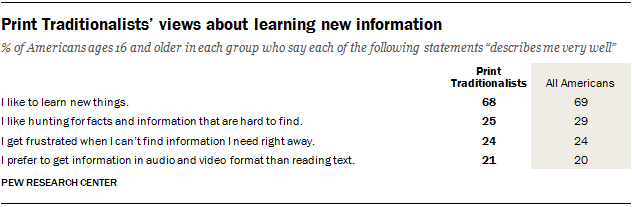
Print Traditionalists’ views and expectations surrounding information are similar to those of the U.S. population as a whole, as shown in the charts below.

Relationship to public libraries
Public library use and experiences
Like those in the Solid Center, Print Traditionalists’ library habits generally do not differ too much from the general population:
- 55% of Print Traditionalists have library cards.
- Most Print Traditionalists say that their library use has stayed about the same over the past five years, and 23% say their library use has decreased in that time. Another 9% say their library use has increased (somewhat lower than the national rate for all recent library users).
- 48% of Print Traditionalists say they have visited a library in person in the past year.
- Among parents of minors, 61% say their children have visited a library in the past year, somewhat lower than the rate for the general population (70%).
Though Print Traditionalists are less likely to have ever used a library website (39%) than higher engagement groups, one in five (20%) have used one in the past year, compared with just 5% of those in the Solid Center. They visit library websites monthly at most—47% of website visitors do this—with another 48% visiting less often. Most members of this group say it would be easy to use a library website if they wanted to, with 42% saying it would be “very easy.”
Like those in the Solid Center, Print Traditionalists’ in-person library visits are relatively infrequent: Among recent library visitors, only 5% say they visit at least once a week, and most visit either monthly (47%) or less frequently (48%). However, Print Traditionalists tend to live farther from public libraries, with just 11% reporting they live within 5 miles of the nearest library. Similarly, though 62% of all Americans ages 16 and older say it would be “very easy” to visit a public library in person, this is true for only 49% of Print Traditionalists.

Though they tend to live farther away from their libraries, Print Traditionalists’ familiarity with what their libraries is in line with the national benchmark: They are about as likely to know all or most of the services their library offers (21%) and to say it’s usually easy or very easy to find what they’re looking for at the library (93%). They have also had very positive experiences at public libraries:
- Like other high and medium engagement groups, almost all those who have visited a library say that libraries are welcoming places (97%).
- 70% describe their library as a nice, pleasant place to be.
- Just 7% say they have ever had a negative experience using a public library.
Public library attitudes
Overall, Print Traditionalists have more positive views of public libraries than those in the Solid Center, and most strongly think that libraries are important to their communities in many ways. Asked about the impact of newer technologies on libraries’ roles, Print Traditionalists are less likely to think that people do not need public libraries as much as they used to because they can find most information on their own.

Along these lines, they are more likely than the general population to say it would have a major impact on their community as a whole—69% say this. And 25% say that their local public library’s closing would have a major impact on them and their families, more than those in the Solid Center (18%).
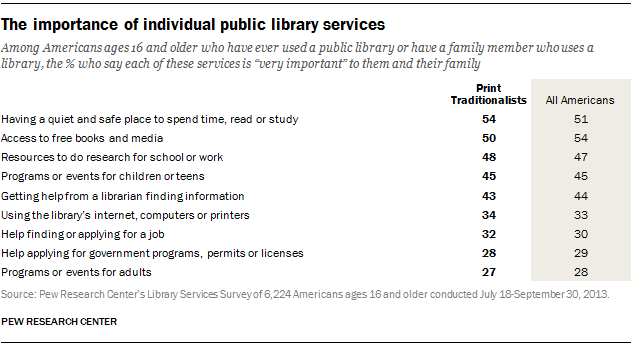
One of the more interesting aspects of their relationship to libraries is that despite their fairly low rates of personal library use, Print Traditionalists are generally as likely as other respondents—and often more likely than Solid Center members—to say that various library services are very important to them and their families, as shown in the following chart.