
About three in ten Americans ages 16 and older are “highly engaged” with public libraries. Those in this bracket sort into two basic groups: Library Lovers, who represent the 10% of Americans with the highest levels of library engagement; and Information Omnivores, who represent an additional 20% of Americans.
As a whole, the high engagement groups are defined by their high rates of library usage and their extremely positive views about libraries’ roles in their communities. The vast majority visited a public library or used a public library website in the past year—far higher rates than the general population. They also appreciate what libraries do for their communities, and value a range of library services from book lending to children’s programs.5
The groups’ interactions with libraries fit into a broader array of involvement in their communities. They are active in their localities, taking advantage of a range of cultural and recreational activities. They feel they have the capacity to effect change for the better in their communities. In addition, they are heavy book readers and news consumers, and feel self- sufficient in pursing the information they need. And contrary to the idea that the internet is replacing the need for libraries in people’s lives, these high engagement groups also report some of the highest rates of technology use in our sample.
Demographically, these two groups—Library Lovers and Information Omnivores—are quite similar. Both groups are dominated by women, are relatively well educated, and contain a high proportion of college graduates and graduate-degree holders. High engagement users also tend to be younger, and are more likely to be in life stages where libraries can play a big role; they contain a disproportionate number of parents, students, and young people looking for jobs.
Yet while the groups share many similarities, they are not identical. One of the main differences between the two high engagement groups is simply the intensity of their library use. For instance, though most visited a library in the past year, the frequency of their visits is very different:
- Among the 87% of Library Lovers who visited the library in the last 12 months, 58% go to the library every week—and all visit at least once a month.
- Among the 81% of Information Omnivores who visited the library in the last 12 months, just 3% go to the library every week, while 12% go several times a month and 35% visit about once a month.

These differences extend to their use of libraries’ websites: Among the 83% of Library Lovers who visited a library website in the past year, 98% visit the library website at least monthly; among the 79% of Information Omnivores who visited a library website in the past year, only 23% visit monthly.
Library Lovers are also far more likely to say that their personal library use has increased over the past five years (53%), while most Information Omnivores (62%) say that their library use has stayed about the same.
Other than their library habits, the differences between Library Lovers and Information Omnivores revolve around their economic circumstances, their technology ecology, and the personal value they derive from libraries.
For instance, Information Omnivores are more likely than Library Lovers to live in higher-income households, to be employed in full time jobs, and to have higher rates of technology adoption. In fact, Information Omnivores are particularly striking for their mobile connectivity, their ownership of smartphones and tablet computers, and their use of social networking sites. Meanwhile, Library Lovers are more likely to have economic stressors in their lives: A quarter of them are looking for jobs. A third live in households earning less than $30,000. Not surprisingly, Library Lovers are much more likely than Information Omnivores to borrow the books they read and say that library services are important to them and their families.
Along these lines, Library Lovers are considerably more likely to feel personal stake in the future of libraries. Both groups believe libraries are important for communities, but Library Lovers are much more likely than Information Omnivores to say the closing of their local library would have a major impact on them.
Library Lovers
Overview

Library Lovers are the heaviest public library users, as well as libraries’ greatest supporters. They represent about 10% of the overall U.S. population.
Library Lovers are frequent users of library services, and are most likely to be knowledgeably about what libraries are doing and the resources they provide. Some 87% have used a library in the past year, and 83% have used a library website in that time; almost all of them use the library at least monthly. The closing of their local library would devastate them personally: 75% say it would have a major impact on them and their families if the library vanished.
Beyond their library use, they enjoy reading, keeping up with the news, and are comfortable navigating many types of media and information. Notably, they are the most prolific readers, especially of books: 66% read a book daily or almost every day, and they read an average of 27 books in the past 12 months. And despite the fact that most generally prefer to borrow books rather than purchasing them, a majority of Library Lovers are frequent patrons of bookstores: 57% say they visit bookstores regularly, more than any other group.
Demographically, this group has the highest share of women (62%) of any group. Library Lovers are especially likely to be well-educated and have very high levels of technology use; most are comfortable finding many types of information on their own, and love to learn new things. However, with a disproportionate number of parents, students, and job seekers, many are also at life stages that predispose them to rely on library resources; for instance, they contain the greatest proportion of parents of minor children (40%), and almost all (96%) of those parents took their children to a library last year. And though they have high levels of education and relatively high levels of household income, Library Lovers are also more likely than some other groups to be non-workers or working in part-time jobs.
Socially, they are deeply networked and embedded in community activities. They know their neighbors, socialize regularly, and are plugged into their neighborhoods and communities as the heaviest patrons of bookstores, museums, cultural events. Politically, they are more likely than some other groups to be liberal and identify as Democrats.
As mentioned above, the lives of Library Lovers are full of technology: 95% use the internet; 92% have cell phones and 58% have smart phones; 72% connect with mobile devices. They are also near the top among the groups when it comes to ownership of e-book readers (30%) and tablet computers (39%). However, they also value the resources that libraries provide for others in their community, not just themselves; despite their own high rates of technology use, they think that libraries are just as important today as in the past for finding information.
Who they are
Demographics
As a group, Library Lovers have noticeably higher proportions of women, married adults, and parents with minor children living at home. They are more likely to be well-educated and relatively upscale in household income, but there are signs of economic challenge among them, too:
- Gender: Library Lovers are the most heavily female-dominated group: 62% of them are women, and only 38% are men.
- Age: Their median age is 44, making this one of the younger groups, but more than a decade older collectively than the Young and Restless group.
- Income and jobs: They are a somewhat upscale group in terms of household income: 39% live in households earning more than $50,000. Still, relatively high proportions of them don’t work (21%) or have part-time jobs (17%) and 25% say they are looking for jobs. That is likely related to the fact that 23% of them have lost a job or seen a significant decline in household income in the past 12 months. Some 17% are students and 42% work full time.
- Education: 41% have college degrees or graduate degrees, ranking them among the highest group; and another 31% have taken some college courses.
- Marriage and parenting: 59% are married or living with a partner, and 40% are parents of minor children—both the highest proportion among any group.

Other lifestyle notes
Library Lovers are spread across community types, reflecting the general distribution of the population. There are indications that most are deeply connected to their communities, wherever they live. For instance, 84% rate their communities as “excellent” or “good,” and they are tied for the highest ranking group with Information Omnivores in believing their own voices matter in community affairs: 81% say they think people like them have a big or moderate impact on their communities.

They are also more likely to be active in socializing with their family and friends: 83% socialize with family and friends in some form (whether in person, on the phone, or online) on a daily basis. And they are quite likely to know their neighbors: 33% know all their neighbors, a higher proportion than almost any group.
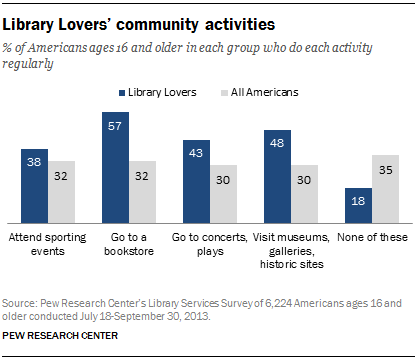
Library Lovers’ higher levels of library use are part of a broader pattern of engagement with their communities. They are significantly more likely to visit bookstores, museums, or concerts than most other groups, and to attend sporting events.
Politically, 35% are Democrats (compared with 31% of the full population) and 28% identify as liberal (compared with 23% of the full population).
Technology and information habits
The lives of Library Lovers are much more likely than other groups to be full of both books and technology. They are the heaviest book readers, and they are the most likely to favor borrowing books over buying them—though they are also frequent patrons of bookstores. They have some of the highest rates of internet users, mobile connectivity, and ownership of e-readers and tablet computers, and outpace most other groups in overall social networking site and Twitter usage.
Technology use
Library Lovers are over-index on many measures of technology use, particularly compared with several other groups: 95% use the internet, and among internet users, 76% use social media. Fully 72% say it would be easy for them to use a library website.

Defining information traits
The singular defining distinction of Library Lovers’ information habits is how much they love books, reading, and information:
- Library Lovers read an average (mean) of 27 books last year, and a median of 12 books.
- They are the most likely group to be heavy patrons of books stores—57% regularly go to them, compared with 32% of the general population.
- However, they also are the most likely group to say they tend to borrow the books they read, rather than buying them: 58% say they borrowed more books than they purchased in the past year, compared with 38% of the general population.
- Beyond books, Library Lovers are heavy consumers of information and news in general: 69% read a newspaper in print or online daily or almost every day, and 66% read a book that frequently.

Library Lovers are more active in than the general population other ways as well. They are more likely to listen to music or the radio on a daily basis, and are also more likely to socialize with family and friends. They are somewhat less likely to watch television or movies on a daily basis.
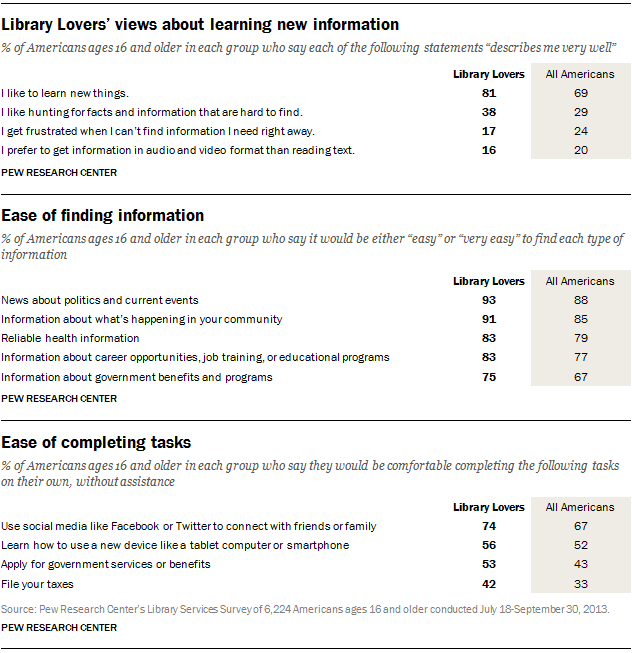
In response to a series of questions about their information-seeking habits, Library Lovers also stand out in the answers about how much they like learning new information, that it would be easy for them to find information on many topics, and that they would feel comfortable on their own completing a variety of information-seeking tasks (rather than seeking help on those activities). Library Lovers are among the least likely groups to say they get frustrated when they can’t find information right away, or that they prefer to get information in audio or video format.
Relationship to public libraries
Library Lovers are the most enthusiastic users of libraries and the most appreciative of their local library’s role in their own lives, as well as in the community. Almost all of them view public libraries as welcoming and extremely useful places that are easy to navigate and provide a range of important resources.
Public library use and experiences

Library Lovers are the most prolific users of libraries by virtually every measure of usage:
- 98% have library cards.
- 87% visited the library in the last 12 months. Among these recent library visitors, 58% of them go to the library every week, and all go at least once a month.
- 83% visited a library website in the past year. Among them, 98% visit the library website at least monthly.
- 53% say their library use has increased in the past five years.
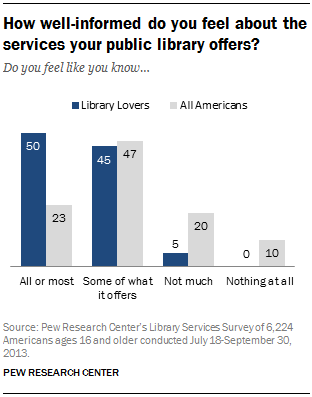
Nearly all of them (98%) say libraries are welcoming places, and 81% say their local library is a nice, pleasant place to be (compared with 67% of all those ages 16 and older). They know their way around libraries: 50% say they know all or most of the services their library offers, and 99% of those who have visited a public library say it is “easy” or “very easy” for them to find what they are looking for.
Among parents of minors, Library Lovers are the highest ranking group of those whose children use the library: 96% of the Library Lovers who have minor children say their children have been to a library in the past 12 months.
Public library attitudes
Library Lovers stand out as the topmost group members who have strongly positive views about the role of libraries in communities.
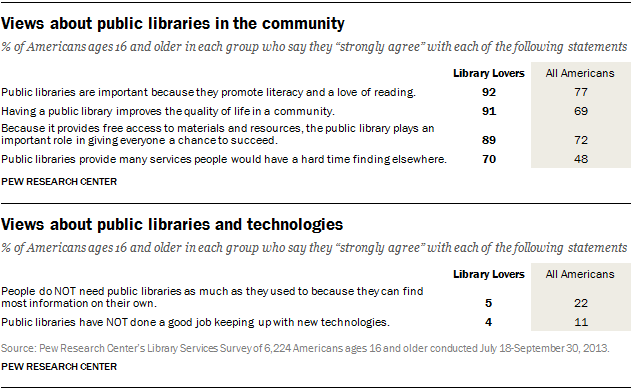
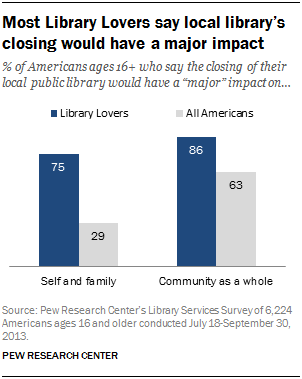
If their library closed they are the group who are most likely to say they would feel the impact acutely. Three-quarters (75%) of Library Lovers say that their library’s closing would have a “major” impact on them and their family, more than twice the rate for the general public (29%). And 86% say that their library’s closing would majorly impact their community as a whole, compared with 63% of all Americans ages 16 and older.
When it comes to individual library services, Library Lovers are the highest-ranking group in their appreciation for every service, including 86% who say that public libraries’ books and media are “very important” to them and their family.

Information Omnivores
Overview

Information Omnivores, the second-highest group in terms of library engagement, represent about 20% of the U.S. population ages 16 and older; this makes this group about twice the size of the Library Lovers group. Like Library Lovers, they have extremely high levels of engagement with and appreciation for public libraries in their communities, but report lower levels of personal reliance on library services.
As their name implies, Information Omnivores are avid consumers of media and information, and report even higher rates of technology use than Library Lovers. Their library use is high, but not quite as high as Library Lovers—either for themselves or their children. Like Library Lovers, this group has a disproportionate number of parents. As they are somewhat more financially well-off than Library Lovers, it may be that they can afford to purchase more services themselves instead of relying on libraries. However, they are still huge fans of libraries, especially in terms of their value for the communities as a whole.
Who they are
Demographics
Many Information Omnivores sit at top of the socio-economic ladder. They are the group with the highest proportion of financially respondents, and they are more likely to have relatively high levels of education. It is also the group with the greatest share of members working full time. The group also includes significantly higher proportions of women and parents compared with the general population. It also contains a large share of young people and people who live in big cities, and its respondents tend to rank high in community engagement and a sense of self-efficacy:
- Gender: 57% of Information Omnivores are women, the highest proportion of any group except Library Lovers.
- Age: Their median age is 40, making them a somewhat younger group than Library Lovers and the second youngest group in the typology.
- Race and ethnicity: Information Omnivores very closely mirror the general population in our sample: 68% are white, 12% are black, and 12% are Hispanic.
- Household income: This group has the highest proportion of financially well-off respondents, with 35% of its members living in households earning $75,000 or more.
- Education: They are a relatively highly educated group: 73% of adults in this group have had some college experience, including the 41% who have college or graduate degrees. In addition, 23% are currently students, one of the highest proportions of any group.

Other notable characteristics:
- Employment: They are the most likely group to be employed: 52% have full time jobs.
- Parents: 36% are parents of minors—similar to Library Lovers –but they are more likely to be parents of young children (ages 2-5). The vast majority of these parents took their child to the library in the past 12 months (90%), but Information Omnivores are somewhat less likely than Library Lovers to have done so.
Other lifestyle notes
Information Omnivores are more likely to live in large cities or suburbs compared with other groups, as shown in the following chart.
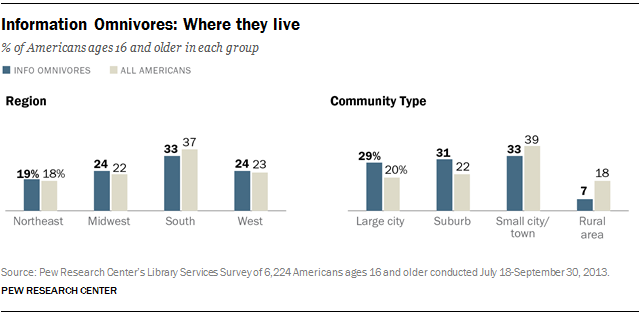
Relatively speaking, Information Omnivores tend to be newcomers to their communities: 39% have lived in their community for five years or less. Still, they are more likely to view their communities positively than any other group (84% rate their community as a “good” or “excellent” place to live). They are also more likely to think their voice matters in their community, as 36% say people like themselves can have a “big” impact on making their community a better place to live. Reflecting their cosmopolitan ways, they are more plugged in than most groups to certain activities in their communities. Still, they are significantly less likely than Library Lovers to say they know all their neighbors (25% versus 33%). But Information Omnivores socialize a lot: 84% do so with family and friends in person, on the phone, or online daily.

Politically, Information Omnivores tilt Democratic (33% say this) and liberal (29% say this), at higher rates than the general population.
Technology and information habits
One of the most striking characteristics of Information Omnivores is their technology ownership and use. They are tied for the highest ranking group as cell owners and smartphone owners, and are the most intense users of the internet: 90% of the internet users go online every day or almost every day. They are also the top group of tablet computer owners, and are tied with Library Lovers as the leading group owning e-book reading devices.
As their name implies, they are comfortable with a wide variety of information types, and engage with a variety of media sources. They are also more likely than other groups to read books regularly, though their overall book consumption does not quite approach that of Library Lovers. Their book habits also differ in that they are far more likely to prefer to purchase their books than Library Lovers, who generally prefer to borrow them.
Technology use
Almost all Information Omnivores use the internet (97%), and most (68%) have smartphones. Among internet users, 81% use social networking sites, 25% use Twitter. They are also notable for their significantly higher rates of tablet ownership (46%) and e-readers (33%) compared with almost every other group.

Defining information traits
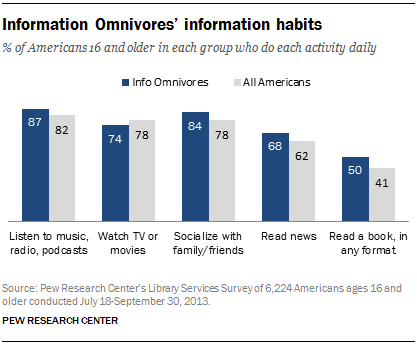
When it comes to information, Information Omnivores stand out in a number of ways. Information Omnivores are just as likely as Library Lovers to listen to music, talk radio, or podcasts (87% do this daily), and reading news offline or online (68%). And like Library Lovers, they are somewhat less likely to watch television or movies (74%) on a daily basis than the general public.
Information Omnivores are more likely than most other groups to read regularly, though they are not as likely as Library Lovers to do so. They rank below Library Lovers in:
- Daily book reading: 50% versus 66%.
- Average number of books read: Information Omnivores read an average (mean) of 17 books in the past 12 months, compared with 27 for Library Lovers, and a median of 10 books in the past 12 months, compared with 12 for Library Lovers.
- Bookstore visiting: 45% of Information Omnivores go to bookstores regularly, compared with 57% of Library Lovers and 32% of the general public.
Among those who read a book in the past 12 months, 52% of Information Omnivores say they bought most of those books and 37% say they borrowed most of the books. Another 10% say they bought and borrowed in equal proportions.
Most Information Omnivores are immersed in information, but few very much mind it: 82% say they like having so much information and only 16% say they feel overloaded. They also stand apart from most other groups—except Library Lovers—in their answers about how much they like learning new information. They are highly confident of their abilities to track down information and master new technologies. They also especially likely to say that it would be easy for them to find information on many topics, and that they would feel comfortable on their own completing a variety of information-seeking tasks (rather than seeking help on those activities).


Relationship to public libraries
Information Omnivores are deeply engaged with libraries, but not quite at the same level as Library Lovers. For instance, they visit libraries, but not nearly at the same level of frequency. Over the past five years, their library use has mostly held steady, rather than risen in the way that Library Lovers has. Their somewhat lower level of engagement with libraries translates into less knowledge about the things that are going on at the local library.
Public library use and experiences
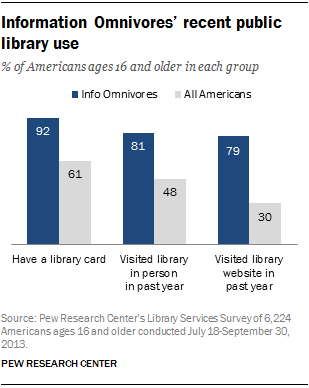
In almost all respects, Information Omnivores’ engagement with libraries far exceeds national benchmarks:
- 92% have library cards, compared with 61% of all Americans ages 16 and older.
- 81% of Information Omnivores visited the library in the last 12 months, but their visits are less frequent that that of Library Lovers: Just 3% go to the library every week, while 12% go several times a month and 35% visit about once a month.
- 79% visited a library website in the last 12 months, though only 22% of those recent website users visit monthly—the rest log on less often.
- 62% say their library use has remained the same over the past five years; 16% say it has increased and 21% say it has decreased.
- 90% of the Information Omnivores who have minor children say their children have been to a library in the past 12 months.
Information Omnivores do not rate their knowledge of their local library as high as Library Lovers do. Some 55% of Information Omnivores say they know some of what the library offers and 29% say they know all or most of what it offers. They say it is generally easy for them to navigate the library, but not quite as much as Library Lovers: 40% of Information Omnivores say their experience is that it is “very easy” to find what they are looking for when they visit a public library, compared with 55% of Library Lovers who say that. And, befitting their urban status, Information Omnivores say the library is easy for them to get to: 89% live five miles or less from the nearest library.
Public library attitudes
Information Omnivores have strongly positive views of libraries. Nearly all (95%) say their experience is that libraries are welcoming, friendly places; 73% say the physical condition of their local library makes it a nice, pleasant space.

As with other parts of this profile, many of the views of Information Omnivores outrank those in most other groups, but they are a notch or two below the level of personal value expressed by Library Lovers. One striking difference is that Information Omnivores are about half as likely to say that the closing of the local library would have a major impact on them and their families: 39% of Information Omnivores say that versus 75% of Library Lovers. The Information Omnivores are also considerably less likely than Library Lovers to say that library services are important to them and their families.
The groups are much closer in their views that the closing of the library would have a major impact on the community. Perhaps because their technology use is so high, Information Omnivores are less likely than several other groups to say libraries provide services that people would have a hard time finding elsewhere.


