Two-thirds of U.S. adults are overweight or obese3 and nearly half are living with some other chronic condition such as hypertension, diabetes, heart conditions, lung conditions, and cancer. Self-monitoring has been shown to be an ingredient for improving health outcomes, particularly among people trying to control their weight,4 blood pressure, and blood sugar.5 The question that has remained unanswered up until now is: How many people are tracking their health on a regular basis?
In 2010, Pew Internet began to explore the phenomenon of tracking for health, limiting our questions to those who use online tools. We found that 15% of internet users tracked their weight, diet, or exercise routine online and 17% of internet users tracked any other health indicators or symptoms online. Fully 27% of adult internet users said yes to either question, which translates to about one in five U.S. adults who use some form of technology to track a health indicator.
In this study, based on a national telephone survey fielded in August-September 2012, Pew Internet widened the scope of the questions to include all adults and all forms of tracking, not just online.
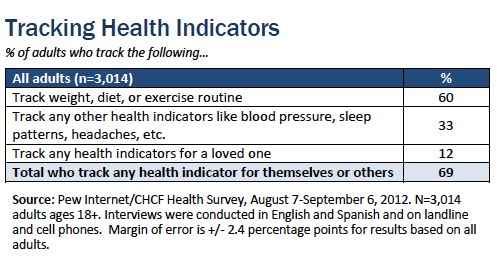
Fully 60% of U.S. adults say they track their weight, diet, or exercise routine. One-third of U.S. adults track health indicators or symptoms, like blood pressure, blood sugar, headaches, or sleep patterns. One-third of caregivers — people caring for a loved one, usually an adult family member – say they track a health indicator for their loved one. When looking at this last group as a segment of the total population, 12% of U.S. adults track a health indicator on behalf of someone they care for.
Added together, seven in ten U.S. adults say they track at least one health indicator. We will refer to this group as “trackers” throughout this report.
Weight, diet, or exercise routine are the most commonly tracked health indicators
Sixty percent of U.S. adults say they track their weight, diet, or exercise routine.
In the general population, women and men are equally likely to report tracking their weight, diet, or exercise routine. Non-Hispanic whites and African Americans are more likely than Latinos to track these basic health indicators: 62%, 59%, and 51% of each group respectively do so. Older adults are more likely than younger ones to track their weight, diet, or exercise routine: 71% of those ages 65 and older do so, compared with 61% of 18-29 year-olds, for example. Sixty-eight percent of college graduates track their weight, diet, or exercise routine, compared with 54% of adults with a high school diploma and 43% of those who have not graduated from high school.
One in three adults track health indicators or symptoms
Thirty-three percent of U.S. adults track health indicators or symptoms, like blood pressure, blood sugar, headaches, or sleep patterns.
Women and men are equally likely to track health indicators and symptoms. African Americans are more likely than non-Hispanic whites or Latinos to do so: 41% report tracking health indicators, compared with 33% of white adults and 25% of Latinos. Fully 52% of adults ages 65 and older track a health indicator, compared with just 20% of those between the ages of 18-29 years old. There are no differences among adults with various levels of education.
One in three caregivers track health indicators or symptoms for their loved one
Twelve percent of U.S. adults track health indicators or symptoms for a loved one.
To establish whether someone is a caregiver, we asked a series of questions about whether, in the past 12 months, they provided unpaid care to a relative or friend. Fully 36% of U.S. adults say they did so, which could include helping an adult relative or friend with personal needs, household chores, finances, or simply visiting to check in. Two-thirds of this group cares for one adult and one-third care for multiple adults. Eight percent of U.S. adults care for a child with a medical, behavioral, or other condition or disability. In sum, 39% of U.S. adults are caregivers.6
Caregiving is an activity that cuts across most demographic groups. Women and men are equally likely to report caring for a loved one, as are people of different educational and economic backgrounds. Adults ages 30-64 years old are the most likely age group to report being a caregiver: 44% say yes, they care for an adult or child, compared with 42% of adults ages 30-49, 36% of adults ages 18-29, and 30% of those age 65 and older.
Thirty-one percent of caregivers keep track of health indicators or symptoms for any of the people they care for. Female caregivers are more likely than their male counterparts to track a health indicator on behalf of their loved one: 35% vs. 26%.
Caregivers are also likely to track their own health: 64% of caregivers track their own weight, diet, or exercise routine and 39% track their own health indicators or symptoms, like blood pressure, blood sugar, headaches, or sleep patterns.
People living with chronic conditions are significantly more likely to track a health indicator or symptom
Some interesting patterns emerge when looking at people living with chronic conditions, who could arguably benefit the most from keeping track of their health in an organized way.
In order to segment this group, we asked a series of questions to determine if a respondent is living with any of the following health problems or conditions and found that:
- 25% of U.S. adults are living with high blood pressure
- 13% are living with asthma, bronchitis, emphysema, or other lung condition
- 11% are living with diabetes
- 7% are living with heart disease, heart failure, or heart attack
- 3% are living with cancer
- 16% are living with another chronic condition
Fully 45% of U.S. adults are dealing with at least one chronic condition. Of those who are living with two or more conditions, 78% have high blood pressure and 45% have diabetes – two health conditions more effectively managed when people track their own data.7
As it turns out, people living with one or more chronic conditions are no more likely than other U.S. adults to track their weight, diet, or exercise routine. But they are significantly more likely to track other health indicators or symptoms and this likelihood increases among those living with more than one condition:
- 19% of U.S. adults reporting no chronic conditions say they track health indicators or symptoms
- 40% of U.S. adults with 1 condition track
- 62% of U.S. adults with 2+ conditions track
One in five adults experienced a significant change in their physical health in the past year — and they are more likely to track
In addition to asking people about negative effects on their health, such as chronic conditions, we included a question about other significant health changes: gaining or losing a lot of weight, becoming pregnant, or quitting smoking. One in five U.S. adults (18%) says they experienced at least one of these changes in the past year.
These adults are no more likely than other people to track their weight, diet, or exercise routine: 63% do so. But adults who have gone through a significant health change in the past year are more likely than other people to track another health indicator or symptom: 41% vs. 31%.
Tracking on paper, spreadsheet, mobile device — or just “in their heads”
One limitation of the Pew Internet Project’s 2010 study on health tracking was our focus on technology. This time we set the internet’s impact on health in context, asking people a wider range of questions about how — and how often — they track their weight, diet, exercise routine, or other health indicators.
When asked to think about the health indicator they pay the most attention to, either for themselves or someone else, fully half of trackers in the general population (49%) say they do so “in their heads.” Men are more likely than women to keep track in their heads (54% vs. 44%) as are younger adults (55% of 18-29 year-old trackers, compared with 44% of those age 65 and older, for example).
This makes some sense since all someone might need to track their weight is a scale — or even a pair of jeans that only fit if someone is at their target weight. This finding is, however, a challenge to technology developers who would like to convince people to upgrade their habits. In order to capture this segment of the market they must strive to create a tool that is as seamless as keeping track in your head.
Another 34% of trackers in the general population say they track the data on paper, like in a notebook or journal. Women are more likely than men to track health data using pencil and paper (40% vs. 28%) as are older adults (41% of those ages 65 and older, compared with 28% of those 18-29 years old).
One in five trackers in the general population (21%) say they use some form of technology to track their health data, which matches our 2010 finding. Specifically:
- 8% of trackers use a medical device, like a glucose meter
- 7% use an app or other tool on their mobile phone or device
- 5% use a spreadsheet
- 1% use a website or other online tool
Sixteen percent of 18-29 year-old trackers use an app or other tool on a mobile phone or device, compared with 9% of 30-49 year-olds, 3% of 50-64 year-olds, and 1% of trackers ages 65 and older. Trackers ages 50 and older are the most likely age groups to use a medical device. Fourteen percent of 50-64 year-olds and 12% of trackers ages 65 and older do so, compared with 5% of trackers ages 30-49 and 1% of 18-29 year-olds.
Respondents were allowed to give multiple responses, so there is some overlap among groups. But there were significant differences between the 50% of trackers who record their notes in some organized way, such as on paper or using technology, and the 44% of trackers who keep track solely “in their heads.” We will note the differences in each section that follows.
People with more serious health concerns take their tracking more seriously
It is worth noting that although we asked peer researchers and expert patients to review our questions in advance of fielding them for the first time, it was a respondent who provided the most important feedback on the question related to how people track their health indicators and symptoms.
Our polling questioners happened to reach someone living with diabetes on the first night of interviews. As she listened to her options, the respondent politely replied that we were not offering her an opportunity to describe her use of a glucometer to track her blood sugar. The interviewer noted her response and we were able to add “medical device” as one of the options for the remainder of the survey’s field dates.
Indeed, it seems that that many trackers living with multiple conditions are more likely to be methodical about collecting their own health data:
- 45% of trackers with 2+ conditions use paper, like a notebook or journal, compared with 37% of trackers with 1 condition and 28% of trackers who report no chronic conditions.
- 22% of trackers with 2+ conditions say they use a medical device, like a glucometer, compared with 7% of trackers with 1 condition and 2% of trackers who report no chronic conditions.
At the same time, a notable number of trackers with chronic conditions say they do not keep formal records. Thirty-seven percent of trackers with 2+ conditions say they keep their progress notes “in their heads,” as do 48% of trackers with 1 condition and 54% of trackers who report no chronic conditions.
Only small groups of trackers living with chronic conditions use any other technology:
- 3% of trackers living with 2+ conditions use a computer program, like a spreadsheet – statistically the same percentage as other trackers.
- 1% of trackers living with 2+ conditions use a website or other online tool – again, about the same as other groups.
- 3% of trackers living with 2+ conditions use an app or other tool on their phone or mobile device.
That last option is significantly more popular among trackers reporting no chronic conditions, 10% of whom say they use an app to track their health.
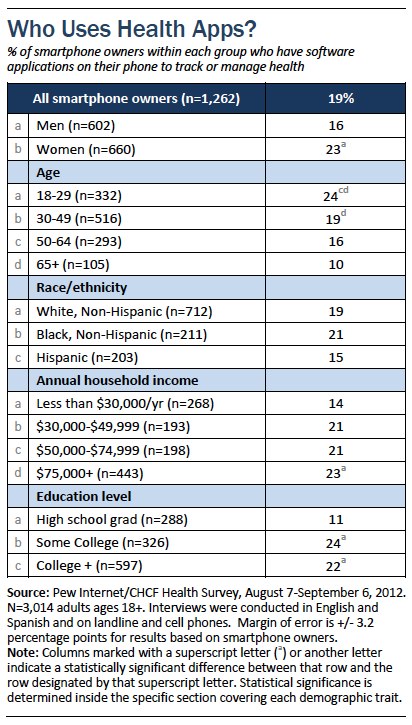
One in five smartphone owners has a health app
To further explore the possibility of incorporating apps into a health regimen, we asked a separate question and found that 19% of smartphone owners have downloaded an app specifically to track or manage health. As we reported in “Mobile Health 2012,”8 women, those under age 50, those who are better educated, and those with an annual household income over $75,000 are more likely to have downloaded a health app.
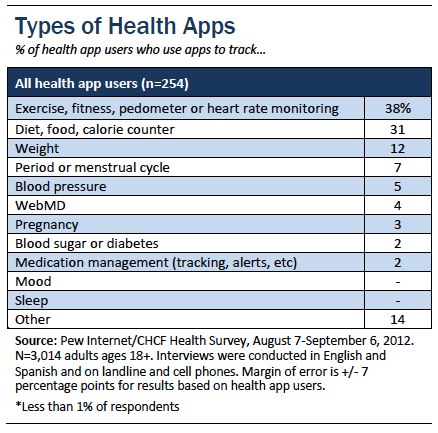
Exercise, diet, and weight apps most popular
Exercise, diet, and weight apps are the most popular types of health apps downloaded. Some 38% of health app users track their exercise, 31% monitor their diet, and 12% use an app to manage their weight. Other health apps mentioned by respondents track menstrual cycles, blood pressure, pregnancy, blood sugar or diabetes, and medication.
Most trackers update their records only occasionally
Digging deeper into tracking in general, we asked respondents to think about the health indicator they pay the most attention to, either for themselves or someone else, and then tell us how often they update their records, whether on a regular basis, or only when something comes up or changes.
Half of trackers (49%) say they update their records only occasionally, when something comes up or changes; half (46%) say they update on a regular basis. Older trackers (age 50+) are more likely than younger ones to track on a regular basis.
Of those who update their records regularly:
- 13% say they update several times per day
- 23% update about once per day
- 15% update 3-5 days per week
- 23% update 1-2 days per week
- 16% update once or twice per month
- 9% update less than once per month
- 2% weren’t sure
Sixty percent of trackers who keep formal records, such as on paper or some form of technology, say they update their notes on a regular basis, compared with 33% of those who only track “in their heads.”
One in three trackers share their notes with someone else
One-third of trackers (34%) say they share their health tracking records or notes with another person or group, either online or offline. Women are more likely than men to share their data (39% vs. 29%) as are older trackers (39% of those ages 65+ vs. 31% of 18-29 year olds).
Of trackers who share their notes:
- 52% share with a health or medical professional
- 22% share with a spouse/partner
- 11% share with another family member
- 8% share with a friend
- 7% share with their parent
- 7% share with their child
- 5% share with their sibling
- 1% share with members of a group, such as a church, community association, volunteer group, etc.
- 5% share with someone else, not included in the above descriptions
Forty-four percent of trackers who use paper and pencil or some form of technology say they share their notes, compared with 24% of those who only track “in their heads.”
People living with chronic conditions are likely to update their data regularly and to share their notes with a clinician
Trackers with two or more conditions are more likely than other groups to say they keep track on a regular basis (rather than just when something comes up) and they are more likely to share their notes with someone else:
- 54% of trackers with 2+ conditions update their notes on a regular basis, compared with 46% of trackers with 1 condition and 43% of trackers who report no chronic conditions.
- 43% of trackers with 2+ conditions share their notes; of those, 71% share with a clinician
- By comparison, 35% of trackers with 1 condition share their notes; of those, 57% share with a clinician. Just 30% trackers who report no chronic conditions share their notes; of those, 37% share with a clinician.
Caregivers are no more likely than other trackers to update their notes regularly, but they are more likely to share
Caregivers who keep track of a health indicator are no more likely than other trackers to say they update their notes on a regular basis. However, 41% of trackers caring for a loved one say they share their tracking data with someone else, compared with 29% of non-caregivers who track. Caregivers who share progress notes are likely to do so with a clinician rather than a family member, which follows the pattern of non-caregivers as well.
Tracking can affect one’s overall approach to health
Why do people go to the trouble of tracking health data, for themselves or for someone they care for? Some say they get results.
Forty-six percent of trackers say that this activity has changed their overall approach to maintaining their health or the health of someone for whom they provide care. In the general population, women are more likely than men to report this effect (49% vs. 42%) as are trackers ages 30-49: 51% of that age group report that tracking has changed their overall approach to health, compared with 42% of trackers ages 18-29, for example.
Forty percent of trackers say it has led them to ask a doctor new questions or to get a second opinion from another doctor. Women are more likely than men to report this effect, as well (43% vs. 37%).
Thirty-four percent of trackers say it has affected a decision about how to treat an illness or condition. There were no notable differences among demographic groups in the general population.
In all, 63% of trackers agree with at least one of those statements of impact.
Trackers who maintain formal notes report a greater impact than those who do not
Trackers who use paper and pencil or some form of technology are more likely than the informal, “in their heads” trackers to report an impact:
- 54% of trackers who record their notes say it has changed their overall approach to health, compared with 39% of trackers who do not take formal notes.
- 48% of trackers who record their notes say it has led them to ask a doctor new questions, compared with 33% of trackers who do not take notes
- 42% of trackers who record their notes say it has affected a health decision, compared with 26% of trackers who do not take notes.
Tracking has had a more significant impact on people living with chronic conditions
Trackers with chronic conditions are significantly more likely to report that these activities have had an impact on their health:
- 56% of trackers living with 2+ conditions say it has affected their overall approach to maintaining their health or the health of someone they help care for, compared with 40% of trackers who report no chronic conditions.
- 53% of trackers living with 2+ conditions say it has led them to ask a doctor new questions or to seek a second opinion, compared with 33% of trackers with no chronic conditions
- 45% of trackers living with 2+ conditions say it has affected a decision about how to treat an illness or condition, compared with 25% of trackers with no chronic conditions.
Three-quarters of trackers with 2+ conditions (76%) agree with at least one of those statements – only 24% say that tracking a health indicator hasn’t affected their health in any of these ways. Fully 68% of trackers with 1 condition report at least one of the three impacts, compared with 55% of those who report no chronic conditions.
Caregivers are also likely to report tracking’s impact
Among trackers, people actively caring for a loved one are more likely than others to say this activity has affected them:
- 52% of caregivers who track say it has affected their overall approach to maintaining their health or the health of someone they help care for, compared with 41% of non-caregiver trackers.
- 50% of caregivers who track say it has led them to ask a doctor new questions or to seek a second opinion, compared with 32% of non-caregiver trackers.
- 44% of caregivers who track say it has affected a decision about how to treat an illness or condition, compared with 26% of non-caregiver trackers.
Seven in ten caregivers who track (72%) agree with at least one of the three statements about the impact of health data tracking, compared with 56% of trackers who are not currently caring for a loved one.
Trackers who experienced a recent significant health change are likely report that tracking has had an impact
Three quarters of trackers who experienced a recent significant health change say that tracking has had an impact in one of the three ways we inquired about in the survey. Taken by turns:
- 58% of trackers who experienced a recent health change say tracking has affected their overall approach to maintaining their health or the health of someone they help care for, compared with 43% of trackers who do not report a recent significant health change.
- 54% of trackers who experienced a health change say tracking has led them to ask a doctor new questions or to seek a second opinion, compared with 37% of other trackers.
- 44% of trackers who experienced a health change say tracking has affected a decision about how to treat an illness or condition, compared with 31% of other trackers.


