Mobile Health
Mobile health continues to climb in popularity, especially among smartphone owners
Now that 85% of U.S. adults own a cell phone—and half (53%) of those are smartphone owners—information is available wherever and whenever people need it.
According to a new survey conducted in August-September 2012, 31% of cell phone owners say they use their phone to look for health or medical information online. That is up from 17% of cell phone owners in September 2010.
Throughout this report we will refer to cell phone owners (85% of adults) and the smaller sub-group of smartphone owners (45% of adults). Smartphone owners lead this activity: 52% have used their phone to search for health information, compared with 6% of other cell phone owners.
Younger adults, minorities, and those in particular need of health information lead the way
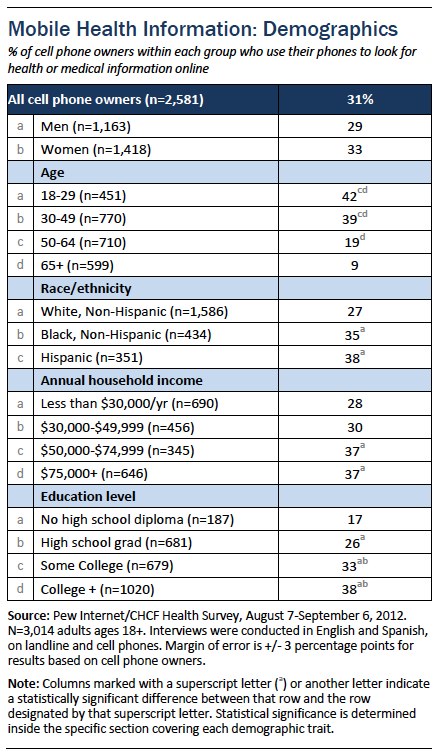
Among all cell phone owners, some demographic groups are more likely than others to look for health information on their phones: Latinos, African Americans, those between the ages of 18 and 49, and college graduates.
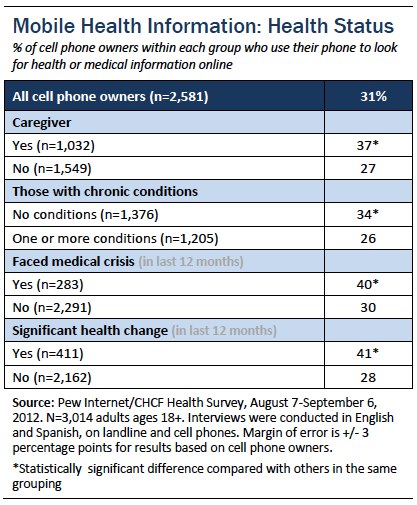
Mobile health information also seems to appeal to certain groups of health consumers: caregivers, people who went through a recent medical crisis, and those who experienced a recent, significant change in their physical health such as gaining or losing a lot of weight, becoming pregnant, or quitting smoking.
Half of smartphone owners have used their phone to look up health information
Again, 53% of cell phone owners in the U.S. say that they own a smartphone. This translates to 45% of all American adults. Younger people are more likely than older adults to own a smartphone, as are people with higher income and education levels.
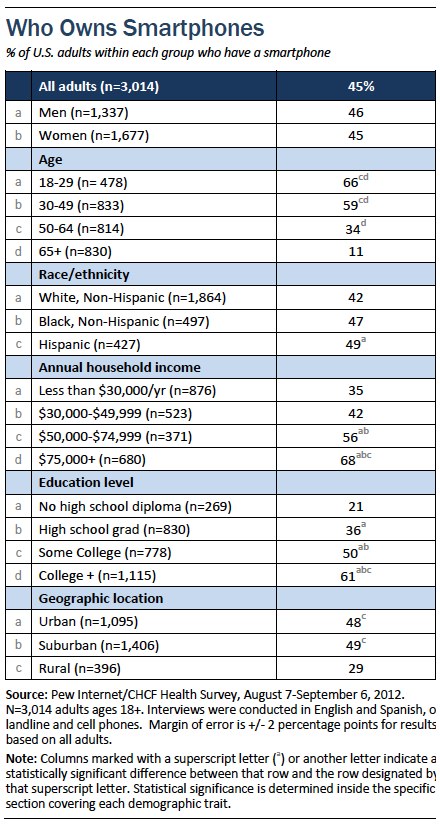
Fully 52% of smartphone owners have looked up health information on their phone, compared with just 6% of other cell phone owners.
A person’s likelihood to use their cell phone to look for health information is amplified by each of the characteristics identified in the tables above: youth, having a higher level of education, living in a higher-income household, being Latino, being African American – and owning a smartphone. Each of these observations holds true under statistical analysis isolating each factor. In other words, it is not just that smartphone owners are likely to be younger than other American adults and both groups are likely to use their phones to look up health information. Each characteristic has an independent effect on mobile health information consumption.
Mobile health growth since 2010
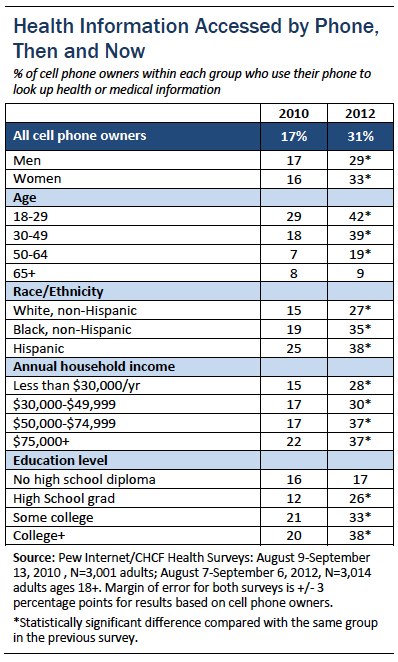
In 2010, when the same percentage of U.S. adults owned cell phones, 17% of cell phone owners reported using their phones to access health information. Today, that number stands at 31%, almost double the previous figure.
Nearly all demographic groups report significant increases in this activity, with the exception of those over 65 and those who did not complete high school. A few groups stand out: cell phone owners who are African American, college graduates, women, those with an annual household income between $50,000 and $74,999, and those between the ages of 30-49.
Smartphone ownership has greatly increased over the last two years and no doubt had an effect on this trend.
Few receive text alerts about health or medical issues
Text messaging is a nearly universal activity, especially among younger cell phone owners, but it has not yet had a significant impact on the health market.
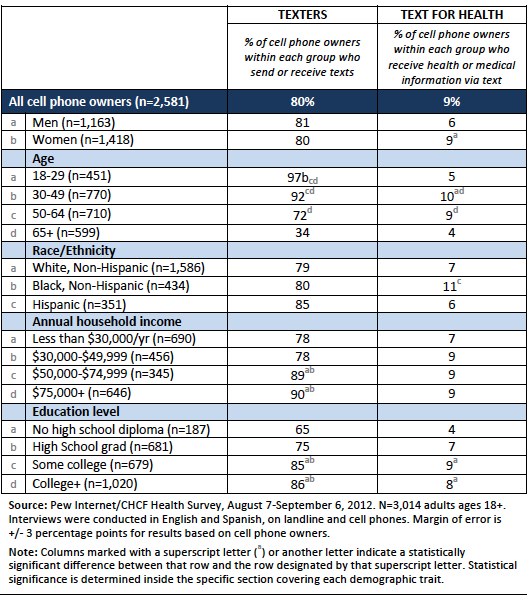
Eighty percent of cell phone owners say they send and receive text messages. Just 9% of cell phone owners say they receive any text updates or alerts about health or medical issues. Women and those between the ages of 30-64 are more likely than other cell phone owners to have signed up for health text alerts.
Smartphone owners are more likely than other cell phone owners to get text updates about health: 9%, compared with 6%.
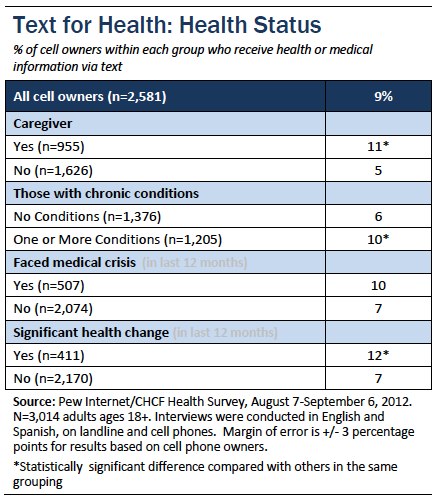
People who are potentially dealing with more serious health situations – caregivers, people living with chronic conditions, those with recent significant health changes – are more likely to engage in this mobile health activity.
One in 5 smartphone owners has a health app
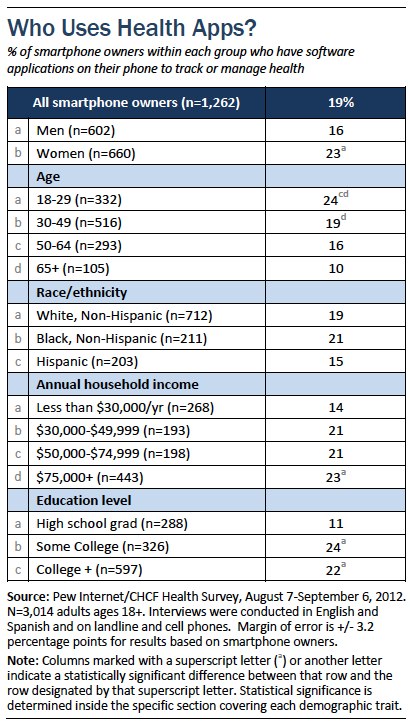
As of April 2012, 84% of smartphone owners had downloaded an app of any kind to their phone.1 By comparison, 19% have downloaded an app specifically to track or manage health. Women, those under age 50, those better educated, and those with an annual household income over $75,000 are more likely to have downloaded a health app.
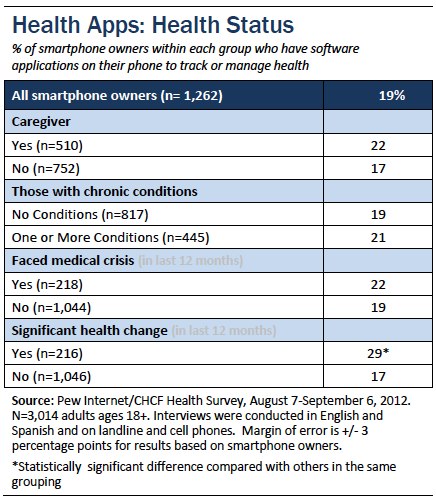
Those who have faced a significant health change in the last twelve months are also more likely to have downloaded a health app.
Exercise, diet, and weight apps most popular
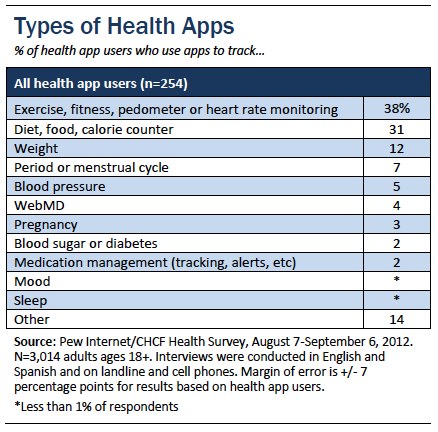
Exercise, diet, and weight apps are the most popular types of health apps downloaded. Some 38% of health app users track their exercise, 31% monitor their diet, and 12% use an app to manage their weight. Other health apps track menstrual cycles, blood pressure, pregnancy, blood sugar or diabetes, and medication. The WebMD app was also cited, along with a number of other brand-name apps (a full list of uncategorized responses is below).
“Other” Health Apps
- “About how the human body works”
- “Hearing”
- “Health insurance app”
- “Personal business app”
- “Brain trainer”
- “Allergy alert, weather channel pollen alert”
- “MD encyclopedia”
- “Hypnosis”
- “Medical handbook”
- “An app for medicines, doctors, and hospitals in the area”
- “Drugs” (cited twice)
- “Kids’ illnesses”
- “Walgreens” (cited three times, twice as “Walgreens”, once as “walgreen app for prescriptions”)
- “Stop smoking”
- “Search app about my health”
- “P tracker women’s health app”
- “Pharmacy doctor benefits”
- “Asthma”
- “Triage” (cited twice)
- “Headaches”
- “Anatomy” (cited twice)
- “First aid”
- “Heart disease”
- “Medical diagnosis app”
- “Insurance tracker”
- “App for monitoring fluids for kidney stones”
- “Blood work”
- “Comparing prescriptions”
- “App for symptoms”
- “Drug guide and diagnosis guide”
-
“Appointment app”


