A note about the charts in this report
The charts in this section are interactive charts developed by iCharts. These graphics can be embedded in any blog or website, or saved as a JPG, TIFF, or other static image, by following the instructions below.
In order to embed an interactive chart into another website or blog:
1. Click the Embed button located under the chart.

2. Copy the code provided in the pop-up box.
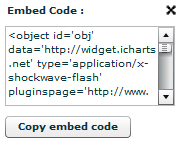
3. Paste the code into your blog or website.
In order to save an image of the chart to your comptuer to use in another website, blog, PowerPoint or PDF:
1. Click the Save button located under the chart.

2. Select an image format type.
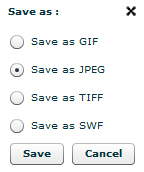
3. Save the image of the chart to your computer.
Chart 1
Chart 2
Chart 3


