65% of internet users have paid to access or download some kind of digital content. Music and software are the most common kinds of content purchased.
Nearly two-thirds of internet users – 65% – have paid to download or access some kind of online content from the internet, ranging from music to games to news articles. Music, software, and apps are the most popular content that internet users have paid to access or download, although the range of paid online content is quite varied and widespread.
In a survey of 755 internet users between 28 October and 1 November 2010, respondents were asked about 15 different kinds of online material that could be purchased or access after a payment. The online content that we were trying to assess in this survey is “intangible” digital products such as software, articles, and music that need not have a physical form. This is in contrast to something we have measured in previous surveys but were not trying to capture here: the use of the internet to purchase “tangible” products such as clothes, CDs, books, or computers or tangible services such as hotel reservations or airline tickets.
In this survey we asked the following question: “Please tell me if you have ever paid to access or to download any of the following types of online content?” And we found:
- 33% of internet users have paid for digital music online
- 33% have paid for software
- 21% have paid for apps for their cell phones or tablet computers
- 19% have paid for digital games
- 18% have paid for digital newspaper, magazine, or journal articles or reports
- 16% have paid for videos, movies, or TV shows
- 15% have paid for ringtones
- 12% have paid for digital photos
- 11% have paid for members-only premium content from a website that has other free material on it
- 10% have paid for e-books
- 7% have paid for podcasts
- 5% have paid for tools or materials to use in video or computer games
- 5% have paid for “cheats or codes” to help them in video games
- 5% have paid to access particular websites such as online dating sites or services
- 2% have paid for adult content
And 6% of internet users said they had paid for another kind of content that had not been mentioned in the list of 15 we offered.
One can use the metaphor of bits and atoms when referring to online content (i.e., bits) and tangible products (i.e., atoms). In this report, we are examining bits rather than atoms and specifically online content that one must pay for rather than accessing for free.
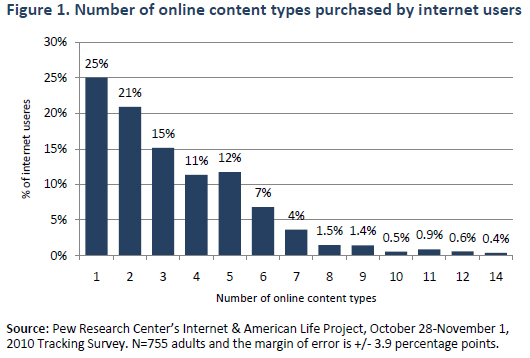
Of those internet users who have purchased online content, nearly half (46%) have purchased only one or two of the types of content covered in our survey . Some 16% have purchased six or more types of content.
Typical user pays about $10 per month for online content.
The average expense for those who have paid for content was approximately $47 per month for material they have downloaded or accessed, including both subscription (an average of $12 per month) and individual file access (an average of $22 per month). However, some extremely high-end users pull the average higher, with most purchasers spending about $10 per month.
Accessing and paying for online content
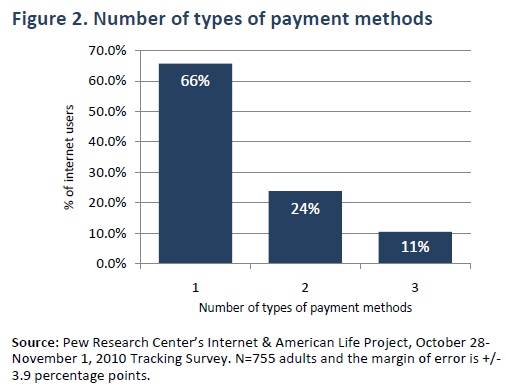
Concerning methods of accessing online content, the majority of the internet users pay for subscription services (23%), versus downloading an individual file (16%), or accessing streaming content (8%).
As shown in Figure 2, most internet users who have accessed online content have utilized only one method of access and payment (66%).
Background: Importance and implications of paying for online content
The internet has become a viable distribution channel for a variety of online content, especially in the era of broadband. The Pew Research Center’s Internet & American Life surveys show that roughly 66% of American adults currently have home broadband connections, which enables users to quickly and easily download software, movies, television shows, music, e-books, and news articles. As a result, more and more commercial entities are exploring the internet as a business model for delivering these types of digital content and media to potential consumers. In addition, non-commercial organizations are looking to the internet to distribute for-fee content. So far, all the material that is distributed by the internet is “intangible,” but some commentators have pointed to a future in which the internet, combined with other technologies such as three-dimensional printers, distribute tangible goods that can be assembled by the end user. 1
Some observers have questioned whether internet users are willing to pay for online content and many media sectors are struggling with the disruption that digital networks have created for their businesses.2 The issue of people’s willingness to pay for online material has enormous implications for media companies, artistic creators, and others who are hoping to sustain themselves – or grow new businesses – by raising revenues through online purchases.
The Pew Internet Project set out to get a broad overview on this subject by exploring what types of online content internet users are purchasing, how they are purchasing it, and who is doing the purchasing. The survey data reported here are from telephone interviews with a nationally representative sample of 1,003 adults living in the continental United States – of whom 755 are internet users. Telephone interviews were conducted by landline (672) and cell phone (331, including 134 respondents who say they do not have a landline phone). Interviews were done in English by Princeton Data Source from October 28-November 1, 2010. Statistical results are weighted to correct known demographic discrepancies. The margin of sampling error for the complete set of weighted data is ±3.7 percentage points, and the margin of error on the internet sample is +/- 3.9 percentage points.
In the survey, we asked if respondents had ever paid to access or download a particular type of online content. We queried for 15 types of online content and then asked an open-ended question about whether respondents had paid for another type of content not on our list. We then asked how respondents paid for online content, whether via a subscription, to download an individual file, or to access streaming online content. Finally, we inquired about how much respondents had paid for subscription services in the last year and how much they had paid for other types of online content in the last month.
Online content versus tangible products and services
We found that 65% of internet users said they had paid for at least one of those 15 kinds of content – or another kind that was not on our list but mentioned by respondents. This is roughly the same as the percentage of internet users who have said in other Pew Internet surveys that they had purchased tangible goods online such as books, music CDs, toys, or clothing. In a survey in May 2010, 66% of internet users said they had done that. 3
We also found in that May 2010 survey that 66% of internet users said they have made travel purchases or reservations online (i.e., airline ticket, hotel room, or rental car).3
Demographic factors
The overall demographic picture of online content purchasers is spelled out in Tables 1 through 4 below. There are some notable findings:
· Similar percentages of men and women internet users say they pay for online content in most of the examples we gave, with the exception of software, for which online men are more likely to purchase than online women.
· There does not appear to be a racial divide among internet users associated with accessing online content, with whites and non-whites equally as likely to have purchased most forms of online content.
· Internet users between the ages of 30-49 are the most likely to have purchased most kinds of content, compared with those who are younger or older.
· The internet users who have college degrees or some college generally are more likely to purchase online content than internet users with a high school or less than a high school education.
· There is also a correlation between income levels and paying for online content, with the internet users who live in higher-income bracket households more likely to pay for various kinds of content than those who live in lower-income brackets.
Concerning paying for music online, the internet users in the 18- 29 and 30-49 age groups are more likely to be online purchasers than those in the older age groups. Also, those in the higher income households purchase music in significantly higher percentages than those in the lower income brackets.
For software, male internet users purchase software online in significantly higher percentages than female internet users. More internet users in the 30-49 age group buy online software than those in other age groups. The more educated and those in the highest income bracket purchase software in significantly higher percentages than those less educated and less well off internet users.
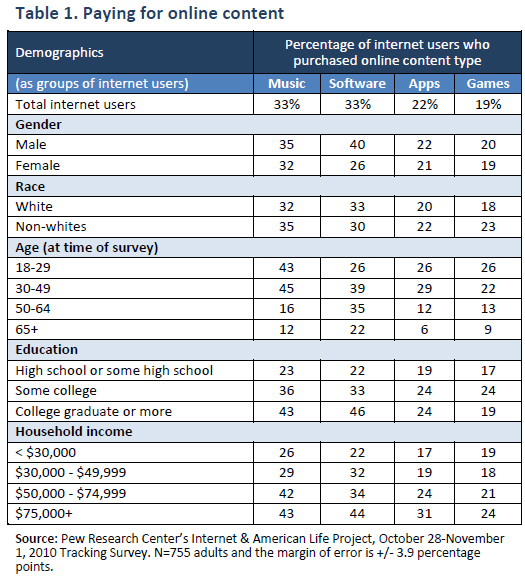
There is a nearly identical disparity with age and income among internet users concerning the purchase of apps.
With games, the only significant difference is related to age. The internet users in the 18-29 and 30-49 age groups are more likely to be purchasers than those in the 50-64 and 65+ age groups.
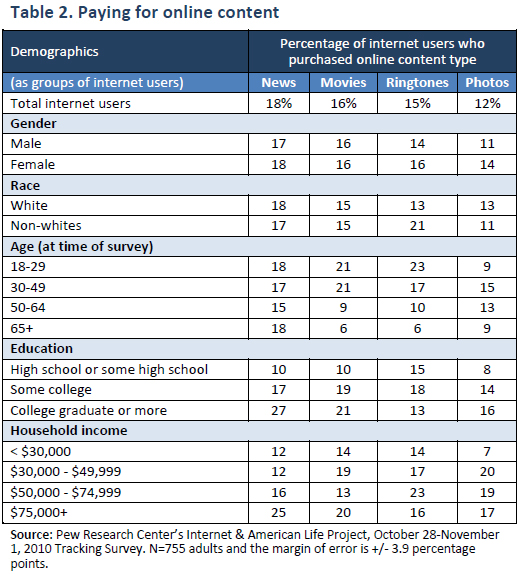
Concerning newspaper, magazine, journal articles or reports, the internet users among college graduates and those in the $75K+ household-income bracket are more likely to be purchasers of this type of online content than internet users in other educational groupings and income brackets.
With online videos, movies, or TV content, internet users in 18-29 and 30-49 age groupings are more likely to be purchasers than those in the older age groupings.
For ringtones, internet users in 18-29 and 30-49 age groupings are content purchasers in significantly higher percentages than those in the older age groupings.
Concerning photos, internet users in household earning $75K+ and $50K-$75K are more likely to buy photos online than those earning less income.
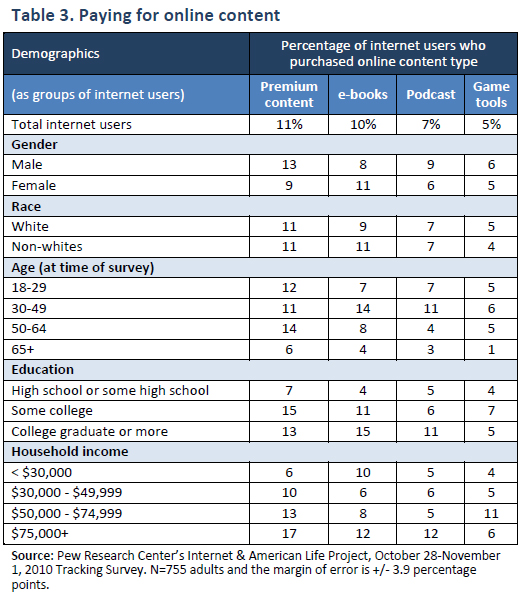
For premium or members-only content on a website, those in the $75K income bracket were more likely to pay for this type of content than those in the lowest income bracket.
Concerning e-books, internet users in 30-49 age grouping paid in significantly higher percentages than those in any other age groupings.
With podcasts, again, internet users in 30-49 age grouping bought in significantly higher percentages than those in any other age groupings.
Focusing on the population that purchases tools, skills, or materials to use in online games, those in the 64+ age group do so in significantly smaller percentages than those in some other age groupings. Those in the $50K-$75k household-income brackets paid for this type of content more than those in the lowest income grouping.
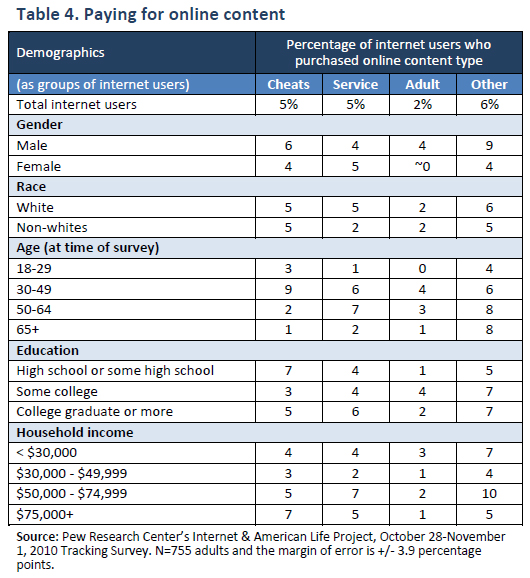
For “cheats” or codes to help in playing online games, a higher percentage of internet users in 30-49 age paid for this type of content than those in any other age groupings. Internet users with a high school education or less also purchased this online content in significantly higher numbers.
With paying for a website or online service, such as a dating site or service, the online Americans in the 18-29 age bracket and 65+ group do so in significantly lesser percentages than those in other age groupings.
Internet-using males are more likely to report paying for adult content and other types of online content than females.
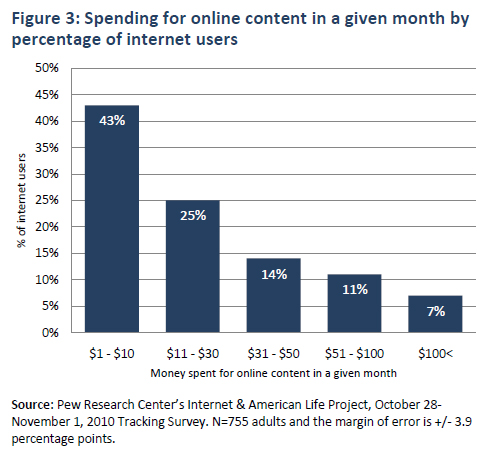
How much do internet users pay for online content?
Of those internet users reporting a dollar amount for purchasing online content, the typical user spent $10 per monthly. However, there was considerable variance, with Figure 3 showing the percentages for five monthly spend categories.
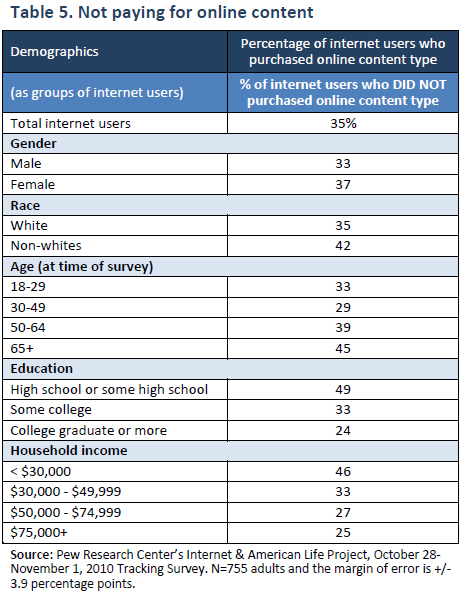
Who doesn’t pay for content?
In analyzing the 35% of internet users who report not purchasing online content, notable findings are:
· A higher percentage of non-white internet users do not purchase online content than internet users who are white.
· A higher percentage of internet users 50 and older do not purchase online content relative to those in young age groups.
· Education and income are correlated with not purchasing online content, with those internet users in the lower education and lower income brackets not purchasing online content in higher percentages than those with higher education attainment and higher incomes.
A detailed demographic breakdown of those who reported not paying for online content is shown in Table 5.
Sources
1. Anderson, C. (2006). The long tail: Why the future of business is selling more of less. New York: Hyperion.
2. Kafka, P. (2009) Who’s Going to Pay for Online Content? A) A Few of You B) Barely Anyone C) You’re Already Paying. All Things Digital, The Wall Street Journal. 16 Nov. Available at: http://mediamemo.allthingsd.com/20091116/whos-going-to-pay-for-online-content-a-a-few-of-you-b-barely-anyone-c-youre-already-paying/
3. Pew Internet & American Life Project Survey, Cell Phones, April 29 and May 30, 2010. Available at https://www.pewresearch.org/internet/Shared-Content/Data-Sets/2010/May-2010–Cell-Phones.aspx
4. Pew Internet & American Life Project Survey, Omnibus Survey, October 28-November 1, 2010.


