How Americans use government websites
On Barack Obama’s first full day in office, the administration released an executive order establishing an Open Government Directive. The order offered a vision for government organized around three principles:
- Government should be transparent, with information about agency operations and decisions available to the public online.
- Government should be participatory, tapping the collective expertise of the American public in government decision-making processes.
- Government should be collaborative, using technology to share and cooperate with other agencies, businesses and nonprofits, and the public at large.
Throughout 2009, a number of federal agencies produced innovative products in support of this strategy. Agencies such as NASA have used social media tools to promote interest in their missions among new demographics, and the State Department used text messaging and Twitter to send highlights of the president’s June 4, 2009 speech in Cairo to more than 200 countries in 13 different languages, posting many of the best responses on its website.1 The FCC’s broadband.gov site allowed citizens to track the development of the agency’s broadband plan online, to share key findings with their friends, and to interact with the agency in real time using tools such as Twitter. The recovery.gov site helped citizens track projects funded by the Recovery Act (the “stimulus bill”) and report potential instances of fraud or waste.
These federal projects represent some of the most visible manifestations of the new online government culture, but state and local agencies are also getting into the act. The District of Columbia’s Apps for Democracy–which offered a cash prize to the developer who could produce the most user-friendly applications based on government data—ultimately led to the development of 47 different applications (with an estimated value to the city of $2.3 million) at a cost of just $50,000 in prize money. The City of Santa Cruz, California used collaborative online tools to enlist the help of citizens in closing a $9 million budget gap. Other politicians and agencies—from Newark Mayor Corey Booker to the Bay Area Rapid Transit Agency—have used social media tools to communicate and interact with constituents in real time. Ultimately, e-government advocates such as Tim O’Reilly envision an era of “government as a platform”, where citizens can use open government data to build their own tools and collaborate directly in the process of governing.2
The report that follows represents the Pew Internet & American Life Project’s attempt to quantify and contextualize these recent developments, and to evaluate the current state of online government. In this chapter, we examine the current state of online government transactions and information seeking on government websites. In Part 2, we examine the extent to which Americans are using tools such as blogs, social networking sites and text messaging to interact with government agencies and with the broader community around government policies. Part Three takes a look at Americans’ attitudes towards online government—specifically, the online offerings that resonate most profoundly with the American public, and how they view attempts by government agencies to interact with citizens in new online spaces. Finally, in Part 4 we examine the extent to which Americans are going online for the raw data of government, and whether this has any relevance to their attitudes towards government openness and accountability.
Most internet users have visited a government website to get information or complete a transaction in the preceding year
Despite the range of options available for interacting with government agencies, most citizen interactions with government involve obtaining information or completing essential tasks. In order to gain a more detailed understanding of how Americans interact with government online, we asked internet users how many of eleven specific activities they had done in the preceding year on a local, state or federal government website. Their responses illustrate the range of government services used by the online population, as eight in ten had visited a government website for at least one of these reasons:
- 48% of internet users have looked for information about a public policy or issue online with their local, state or federal government. The college-educated, those under age 65 and those with relatively high household incomes are especially likely to look for this type of government information online.
- 46% have looked up what services a government agency provides. Young adults (those ages 18-29) and seniors (those 65 and older) are much less likely than 30-64 year olds to go online to look up government services, and this activity is also relatively uncommon among those earning less than $30,000 per year. Additionally, males and those with college experience are more likely than women and those with a high school education to look up government services online.
- 41% have downloaded government forms. This activity is particularly common among whites, 50-64 year olds, college graduates and those with high household incomes.
- 35% have researched official government documents or statistics. As with downloading government forms, this activity is most common among whites, college graduates and those with a household income of $75,000 or more per year.
- 33% have renewed a driver’s license or auto registration. A range of different online demographic groups participate in this activity, although those earning less than $30,000 per year and those without a high school degree are relatively unlikely to do so.
- 30% have gotten recreational or tourist information from a government agency. This activity is especially common among parents, whites, college graduates and those with annual household incomes of $75,000 or more.
- 25% have gotten advice or information from a government agency about a health or safety issue. College graduates are particularly likely to look for this type of information on a government website.
- 23% have gotten information about or applied for government benefits. There are few major demographic differences on this question.
- 19% have gotten information about how to apply for a government job. This type of information seeking is particularly common among African-Americans, the college-educated and those younger than 65.
- 15% have paid a fine, such as a parking ticket. Young adults, African-Americans and Latinos are especially likely to have done this in the last year.
- 11% have applied for a recreational license, such as a fishing or hunting license. Men, whites and those under age 65 are particularly likely to go online for a recreational license.
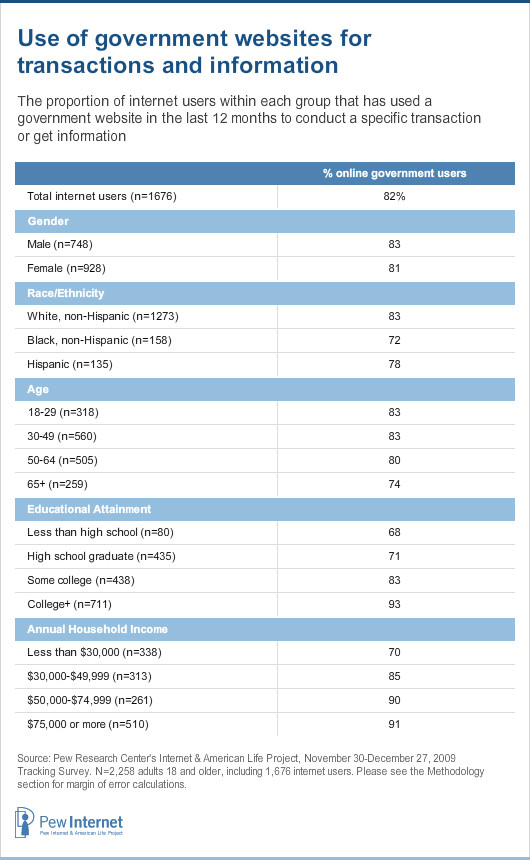
Fully 82% of internet users took at least one of these actions online in the preceding year—throughout this report, we refer to these individuals as online government users. Most internet users take part in a relatively wide range of activities on government websites. Nearly seven in ten internet users (69%) did more than one of these activities online, and the typical online government user took part in four of these activities in the preceding twelve months.
We previously asked a subset of these questions in 2001 and 2003, and while participation in some of these activities has grown over that time, others have not changed appreciably. Our 2001 survey was a callback survey of individuals who had interacted with government online in the past year, so those figures are not directly comparable to this particular survey. However, even accounting for those methodological differences it is clear that many more Americans are now completing simple transactions with government than was the case in 2001. At that time, just 2% of online government users had paid a government fine online—now, 15% of all internet users have done so. Similarly, 4% of online government users had applied for a recreational license online in 2001, a figure that has now grown to 11% of all internet users. Renewing driver’s licenses and auto registrations has also become much more common—from 12% of online government users in 2001 to one-third of all internet users today.
As these transactional interactions with government have become more common over the years, other types of online government activities are no more or less common than they were in the early part of this decade. The proportion of internet users who go online to get health or safety information from a government agency, get recreational or tourist information, research government documents or statistics, or get information about government benefits have not changed significantly since the last time we asked about these activities in 2003. With that said, while the incidence of these activities within the online population has not grown appreciably over the last six years, the growth of the size of the online population (from roughly six in ten adults to three-quarters of all adults now) means that these activities are now more common within the entire US population (taking both internet users and non-users into account) than they were in 2003.
Usage of government websites to get information or complete transactions is relatively common among internet users in all major demographic groups, although it is especially prevalent among those who have attended college, as well as those with a household income of $50,000 or more per year. Additionally, African Americans are slightly less likely to be online government users than whites. Those with a high-speed home internet connection as well as those who go online wirelessly are also more likely than average to use online government services. Fully 85% of home broadband and mobile internet users have accessed information or completed a transaction on a government website in the last year, compared with 68% of home dial-up users and 75% of stationary internet users.
Online Americans prefer to contact government using digital means, but the telephone remains popular among the population as a whole
As we found in our last survey of e-government in August 2003, telephone contact is the overall most preferred contact method when people have a problem, question or task involving the government. Currently, 35% of Americans say they prefer using the telephone in these circumstances, a figure that is relatively unchanged from the 38% who said so in 2003. Similarly, online contact (either sending an email or visiting a website) is the preferred method of contact of 28% of Americans, a figure that is again unchanged from the 26% who cited sending an email or visiting a website five years ago. Among the population as a whole, when faced with a question, problem or task that requires contact with government:
- 35% prefer calling on the phone
- 28% prefer online contact (either visiting a website or sending an email)
- 20% prefer visiting in person
- 11% prefer writing a letter
Interestingly, although the total proportion of Americans who prefer online communication when contacting government has remained unchanged since our last government survey, in that time the relative popularity of sending an email and visiting a website has reversed. In 2003, 17% of respondents said they preferred to visit a website and 9% preferred sending an email; in our current survey, those who prefer email contact rose to 18% and those who prefer visiting a website fell to 10%.
Although the telephone is the preferred means of contact among the population as a whole, a focus on how internet users prefer to interact with government yields much different results. When we examine only internet users and exclude non-users, online contact is the most preferred mode when attempting to reach government, just ahead of calling on the phone. A total of 37% of internet users prefer using online means when trying to contact government, compared with 33% who prefer using the telephone, 17% who prefer to visit in person and 8% who prefer writing a letter.
Broadband and wireless internet users are largely responsible for these differences between internet users and non-users. Two in five home broadband users (39%) prefer online contact when trying to reach government, compared with 23% of home dial-up users. Similarly, 40% of those who access the mobile web prefer online contact, a figure that is slightly higher than the 30% of non-mobile internet users who do so. Online contact does not replace any particular method of offline contact—compared to the population as a whole, internet users (as well as broadband and mobile users more specifically) are slightly less likely to prefer all forms of offline contact relative to non-users. Even so, it is notable that the telephone remains relatively popular even among the technologically proficient, as one-third of home broadband (32%) and wireless internet users (32%) say that the telephone is their favorite means of contact when they need to get in touch with government.
Americans mention a wide range of entities when asked where they went in their most recent visit to a government website
In addition to asking respondents about their online government activities in the preceding twelve months, we also asked all internet users whether or not they could remember the last government website they visited, regardless of when that interaction occurred. Roughly two-thirds of internet users (64%) and three-quarters of online government users (73%) could indeed recall the last site they visited, and we asked these individuals to tell us which site it was that they went to. Their responses were far-ranging, and provide an interesting insight into the spectrum of government agencies and specific government-related tasks in which Americans take part. Among respondents who could remember the last government website they visited:
- One-third (32%) said that their most recent government website interaction was with a specific federal agency. Within this group, the two most common mentions were the website for the Social Security Administration (cited by 21% of those whose last visit was to a federal agency website) and the website of the IRS (15% of federal agency visitors mentioned going to the IRS for information about their federal taxes). Other mentions included immigration/naturalization and customs (6%); the FBI, CIA or Department of Homeland Security (5%); the CDC or NIH (4%); and the Veteran’s Administration (4%).
- One in five (18%) said that they last visited a state government agency website. Among these respondents, state government portal sites (such as Michigan.gov or MyFlorida.com) were the most common destination, cited by 36% of state government visitors. Other common destinations included websites for the state tax office or department of revenue (9%), state employment commission or workforce development department (8%), and state departments of transportation (6%), natural resources (5%) and health and human services (5%).
- One in ten (11%) said that their last online government destination was a local government site. Most of these respondents were visiting the main portal website for their city (39%) or county (30%) government.
- One quarter (27%) said that they last visited a government website to accomplish a specific task. The most commonly mentioned task in this category was related to a driver’s license or auto registration, which was cited by 32% of such respondents. Other common themes included information about recreational or tourist information (13%), unemployment or disability insurance (11%) and information about government jobs (8%). We included these activities in their own separate category because the level of government was often indeterminate in the responses supplied (for instance, a “government jobs site” might be federal, state or local in nature) and to distinguish those who mentioned specific information or task-oriented needs from those who mentioned general government agencies.
- An additional 7% said that they went to the website of an elected official such as Barack Obama, a US Congressperson, a state representative or the governor of their state.
The remaining 5% of responses were those that we were unable to categorize under any of the labels above. A small number of these responses were clearly not government websites, while others were simply too vague to classify into a meaningful category.
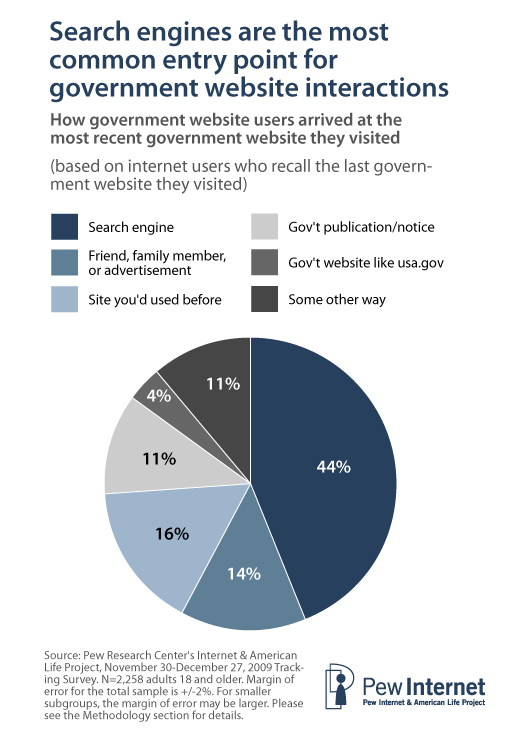
Visitors to government websites rely heavily on search engines to guide them to their destination
Search engines are the most common entry point for government website interactions. Among those who could recall the government website they visited most recently, 44% used a general search engine to figure out where they needed to go. This reliance on search is similar to what we found in our 2003 e-government survey. Using a slightly different question wording, we found that 37% of those whose last government contact involved visiting a web site arrived at that site via a search engine query.3
Other methods for finding government websites made an appearance in our survey, although none were nearly as common as search. Again among those who recalled the last time they visited a government website:
- 16% went to a site they had used before
- 14% found out about the site from a friend, family member or advertisement
- 11% went to a site listed in a government publication or notice
- 4% found the site through a general government website such as usa.gov
- 9% found the site some other way
Search engines are the most common starting point for obtaining online government information among all major demographic groups, although there is some minor variation based on income and age. Those with an annual household income of less than $30,000, for example, are more likely to rely on recommendations from friends, family members or advertisements while those at higher levels of income are more likely to say they went to a site they had visited before. Additionally, those ages 18-29 are significantly less likely than those in other age groups to go to a site listed in a government publication or notice. Otherwise, there are few differences on this question relating to age, educational attainment, gender or race.
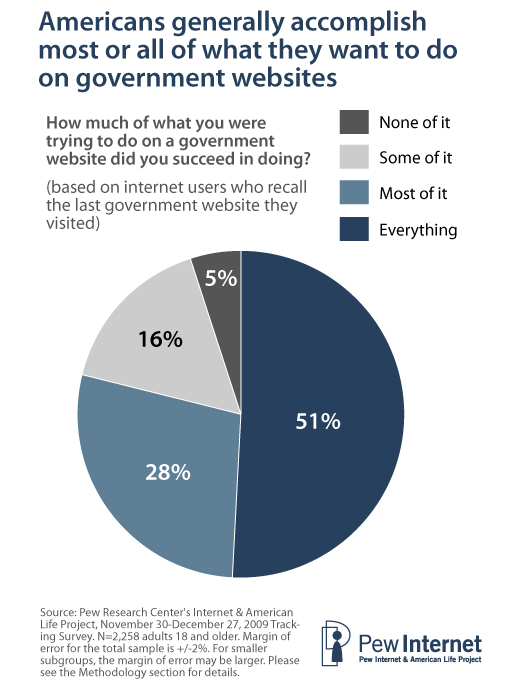
Government web users are largely successful in accomplishing what they set out to do online
Despite the wide range of sites that Americans visit as they seek out government information and services, government website users are generally successful in achieving most or all of what they set out to do online. We asked respondents who could remember the government website they visited last, whether or not they were successful in achieving what they set out to do when they visited the website. Half (51%) said that they accomplished everything they set out to do, while an additional 28% said they accomplished most of what they were trying to do. A total of one in five said that they accomplished either just some (16% said this) or none (5%) of what they wanted to do.
Overall, there is surprisingly little demographic variation when it comes to whether or not someone is successful in accomplishing their goals on a government website. Technology ownership also plays a minimal role—there are no differences on this question between broadband and dialup owners, and wireless internet users are only slightly more likely to find success on government websites than are stationary internet users.
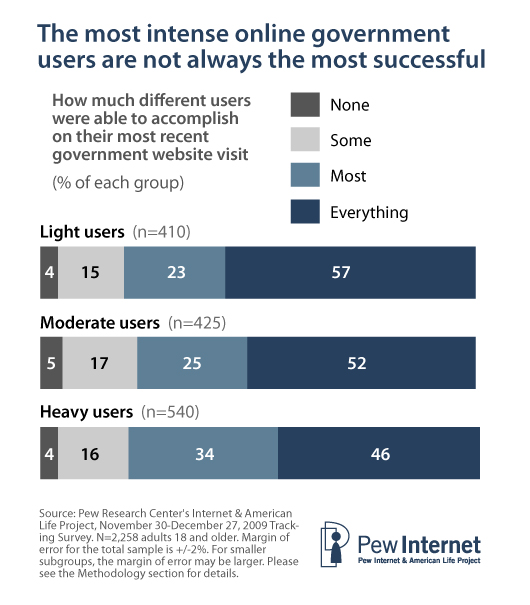
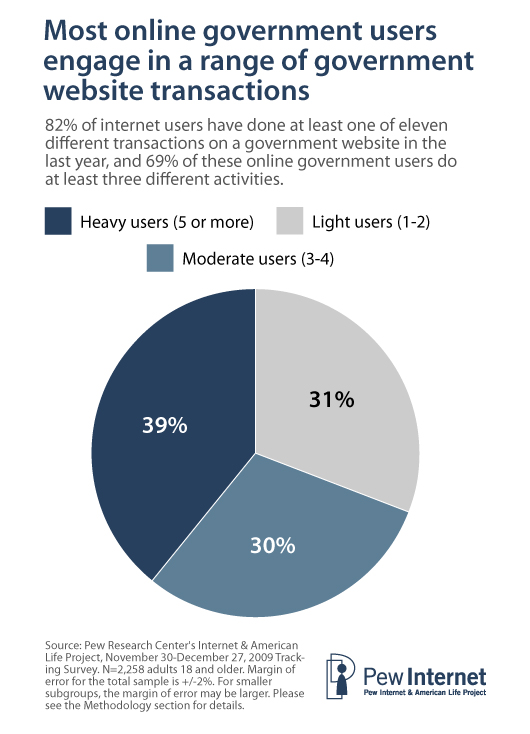
The most wide-ranging users of online government services differ in important ways from those who take part in a narrower range of activities
As noted above, 82% of internet users are what we refer to as online government users, meaning that they had visited some kind of government website in the year prior to our survey. However, some of these online government users access only a small number of online services while others engage in a much wider range of activities. Moreover, those who utilize a relatively wide range of online government services have very different characteristics than those who utilize a small number. As a rough measure of how deeply Americans interact with government online, we divided online government users into three groups: light users, who use 1-2 of the eleven online services we asked about in our survey; moderate users, who use 3-4 different services; and heavy users, who engaged in five or more online government activities in the last year. Three in ten online government users are light (31%) or moderate (30%) users, while two in five are heavy users.
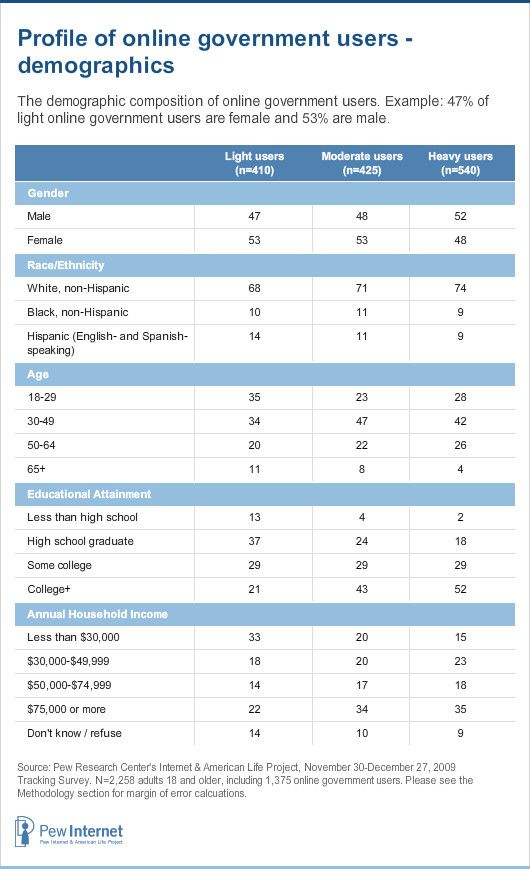
Demographically, heavy and moderate users of online government services have substantially higher levels of income and education than those who interact with government websites only occasionally. Light users are split equally between those with a high school degree or less, and those with some college experience or a college degree. By comparison, eight in ten heavy users have been to college (and just over half have a college degree). Similarly, 33% of light users have an annual household income of less than $30,000 while 35% of heavy users earn more than $75,000 per year. Compared with light users, heavy and moderate users are also slightly more likely to be middle-aged (30-49 years old) and less likely to be younger than thirty or older than 65.
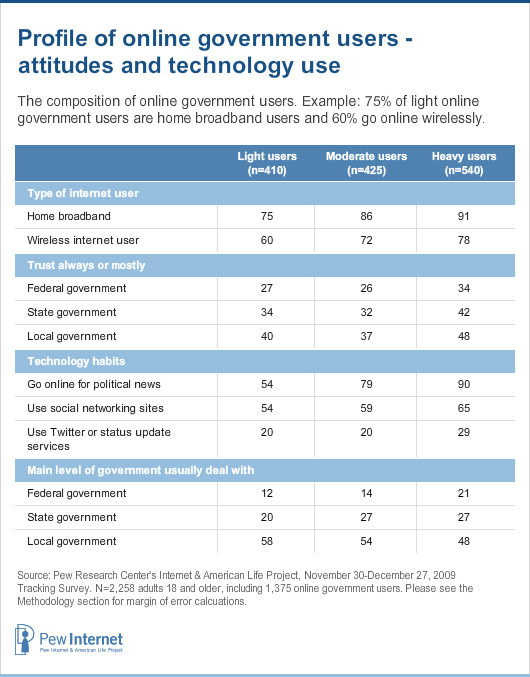
Not surprisingly, the most intense online government users also tend to be fairly technologically advanced. Among heavy online government users (those who did five or more activities in the last year) nine in ten (91%) have a home broadband connection, eight in ten (78%) connect to the mobile internet, and 90% get political news online (with 43% doing so on a typical day). Compared with light and moderate online government users they report somewhat higher levels of trust in government, and are more likely than light or moderate users to deal primarily with the federal government rather than local government agencies.
44% of all adults have had an offline interaction with government in the last year, and Americans frequently use multiple channels to access government services and information
While the primary purpose of this survey was to measure online interactions with government, we also asked a series of questions dealing with more traditional offline forms of government engagement as well. In the twelve months preceding our survey, 44% of all Americans contacted their local, state or federal government via offline means. Roughly one in three (29%) called a government office or agency on the phone, one-quarter (24%) visited an office or agency in person and 17% wrote a letter to a government office, agency or official.4 Since we last asked about offline government contact in August 2003, the proportion of Americans who contact government via telephone or in-person contact has risen by seven and six percentage points respectively, while the proportion of Americans who contact government via letter is comparable to what we found in 2003. In total, the proportion of Americans who contacted any level of government via letter, telephone or in-person visits in the preceding twelve months rose five percentage points, from 39% of all adults in 2003 to 44% of all adults in 2009.
Demographically, contact with government via offline means is most common among whites, those with higher levels of income and education, and those between the ages of 30 and 64. Minority groups, young adults, seniors, those who have not attended college and those with household incomes under $30,000 per year are much less likely to have been in contact with government in the last year using offline channels. Generally speaking, those who contact government using offline means are demographically similar to online government users. The primary difference involves age—online government users are younger, with a median age of 39 (those who contact government offline have a median age of 47).

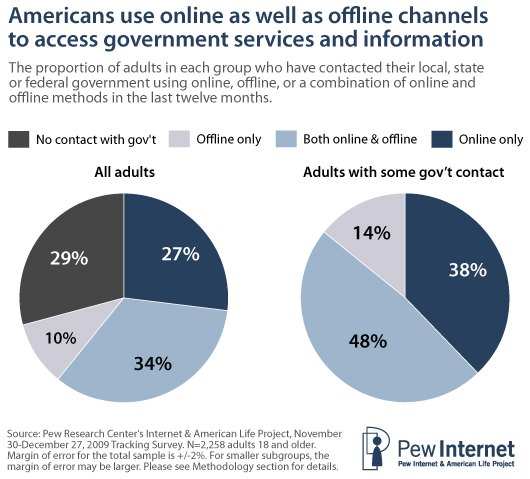
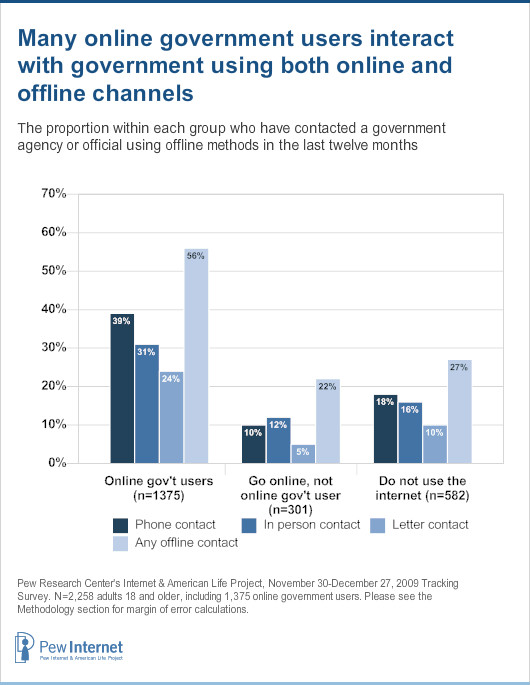
Americans often use online as well as offline channels to access government services and information. Among all adults, one third (34%) had an online interaction on a government website and also contacted a government agency or official using offline means (via telephone, letter or in person). One quarter (27%) had an online interaction only, while one in ten had only offline interactions. The remaining 29% said that they had not interacted with government using any of the different platforms we asked about in our survey. Looking only at those adults who had some sort of interaction with a government agency or official in the twelve months preceding our survey (in other words, excluding the 29% with no government interactions) nearly half (48%) had both an online and offline interaction with government in the preceding twelve months.
Looking specifically at online government users, it is clear that online contact is for these Americans a supplement to, rather than a replacement for, contact with government through more traditional means. The majority of online government users interact with government agencies using multiple channels—both online and offline. Compared with those who use the internet but have not gotten information or completed a transaction on a government website in the last year, or to those who do not go online at all, online government users are much more likely to have recently engaged in offline interactions with government. Overall, more than half of online government users have also gotten in touch with a government office or agency in the last year using offline means—either in person, using the phone or writing a letter. This is well above the overall average for all adults (44% of whom have done this in the last year).
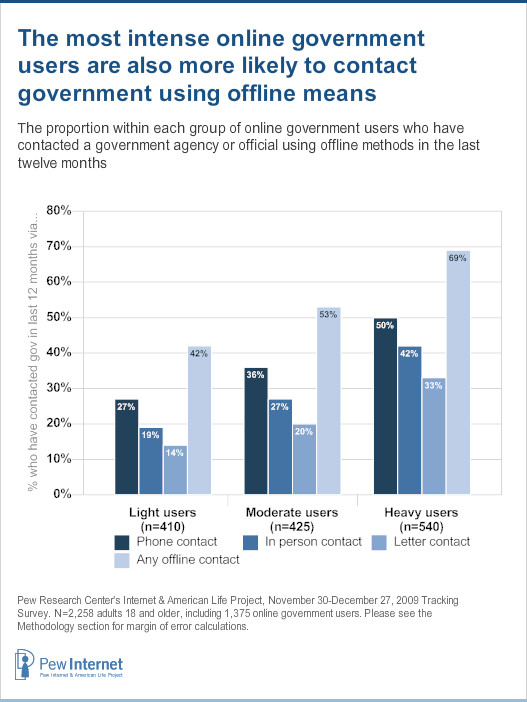
A similar story emerges when we analyze offline government contact by the light, moderate and heavy online government users we defined earlier in this report. Fully 69% of heavy online government users (those who engage in five or more types of online government transactions) contacted government via offline means in the last year, compared with 53% of moderate users (those who engage in 3-4 online government activities) and 42% of light users (those who engage in 1-2 different online activities).
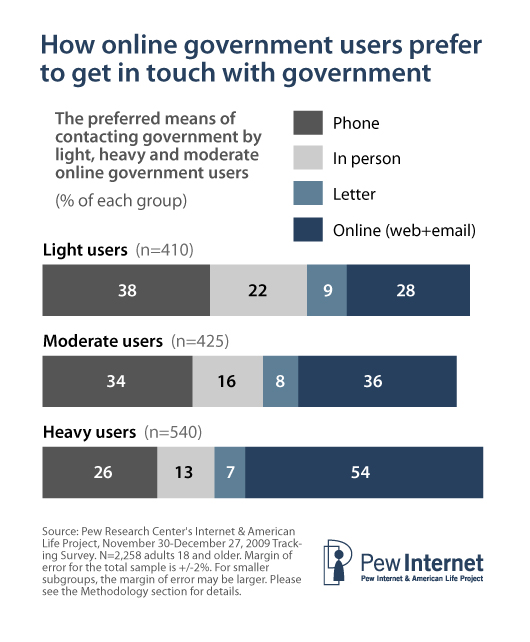
The more government websites an individual visits, the more likely that person is to prefer contacting government agencies and officials using online tools. While 28% of light online government users prefer contacting government agencies or officials via email or visiting a website, that rises to 36% among moderate online government users and to more than half (54%) for heavy users.
Online government users who visit a range of government websites are also much more likely than light or moderate users to use new tools such as email, blogs, social networking sites or online video to get information or keep in touch with government, and to take part in the online discussion around government issues or policies. These findings will be discussed in more detail in Parts 2 and 3 of this report.
Interestingly, heavy online government users are actually less likely than light or moderate users to have accomplished everything they wanted to do on their last visit to a government website. More than half (57%) of light online government users accomplished everything they were trying to do on their last visit to a government website, compared with 46% of heavy users. Heavy users were more likely to say that they accomplished “most” of what they were trying to do—34% said this, compared with 23% of light users. It is unclear why heavy users are less likely to accomplish all of what they need to do, although it is possible that these users are attempting to perform more complex tasks that require both online and offline contact—as noted above, the heaviest online users were especially likely to contact government offline as well.