The internet gives citizens new paths to government services and information
As government agencies at all levels bring their services online, Americans are turning in large numbers to government websites to access information and services. Fully 82% of internet users (representing 61% of all American adults) looked for information or completed a transaction on a government website in the twelve months preceding this survey. Some of the specific government website activities in which Americans take part include:
-
48% of internet users have looked for information about a public policy or issue online with their local, state or federal government
-
46% have looked up what services a government agency provides
-
41% have downloaded government forms
-
35% have researched official government documents or statistics
-
33% have renewed a driver’s license or auto registration
-
30% have gotten recreational or tourist information from a government agency
-
25% have gotten advice or information from a government agency about a health or safety issue
-
23% have gotten information about or applied for government benefits
-
19% have gotten information about how to apply for a government job
-
15% have paid a fine, such as a parking ticket
-
11% have applied for a recreational license, such as a fishing or hunting license
Throughout this report, we refer to anyone who did one or more of these activities in the preceding twelve months as an online government user, and most of these online government users exhibit a relatively wide range of behaviors: the typical online government user engaged in four of these activities in the last year.
The way we ask about the use of government services has changed over the years, making direct comparisons to our prior findings difficult. However, even accounting for these methodological changes it is clear that going online to complete basic transactions with government (such as renewing a license or paying a fine) is now much more commonplace than it was earlier in the decade. Conversely, online informational activities (looking up services, downloading forms, etc) are roughly as common within the online population as they were the last time we asked about these activities in 2003.
In this report, we identify several other common characteristics regarding citizens’ interactions with government. Specifically, these interactions are frequently:
-
Data driven – Efforts by government agencies to post their data online are resonating with citizens. Fully 40% of online adults went online in the preceding year to access data and information about government (for instance, by looking up stimulus spending, political campaign contributions or the text of legislation). These “government data users” are discussed in more detail in Part 4.
-
Organized around new online platforms – Citizen interactions with government are moving beyond the website. Nearly one third (31%) of online adults use online platforms such as blogs, social networking sites, email, online video or text messaging to get government information. These “government social media users” are discussed in Part 2.
-
Participatory – Americans are not simply going online for data and information; they want to share their personal views on the business of government. Nearly one quarter (23%) of internet users participate in the online debate around government policies or issues, with much of this discussion occurring outside of official government channels. These “online government participators” are also discussed in more detail in Part 2 of this report.
These are among the key findings of a Pew Internet and American Life Project survey of how Americans interact with government online. Some of the other findings from this research:
40% of online Americans have gone online for data about the business of government
Recently, many government agencies have begun making data such as agency spending, visitor logs or political donations available to citizens as a way to encourage openness and transparency in government. Indeed, Americans appear to have a fairly healthy appetite for such information, as 40% of internet users took at least one of the following actions in the twelve months preceding our survey:
-
23% of online adults looked online to see how money from the recent stimulus package was being spent
-
22% downloaded or read the text of legislation
-
16% visited a site that provides access to government data, such as data.gov, recovery.gov or usaspending.gov
-
14% looked for information on who contributes to the campaigns of their elected officials
At least when it comes to the federal government, these government data users tend to have more positive attitudes towards government openness and accountability. However, political ideology and partisan affiliations tend to outweigh this effect. Specifically, Democrats (and Democratic-leaning independents) tend to have more positive attitudes towards the federal government’s openness compared with two years ago if they go online for government data. On the other hand, Republican voters tend to cast a skeptical eye towards government openness whether they get this type of data online or not.
More information about government data users can be found in Part 4.
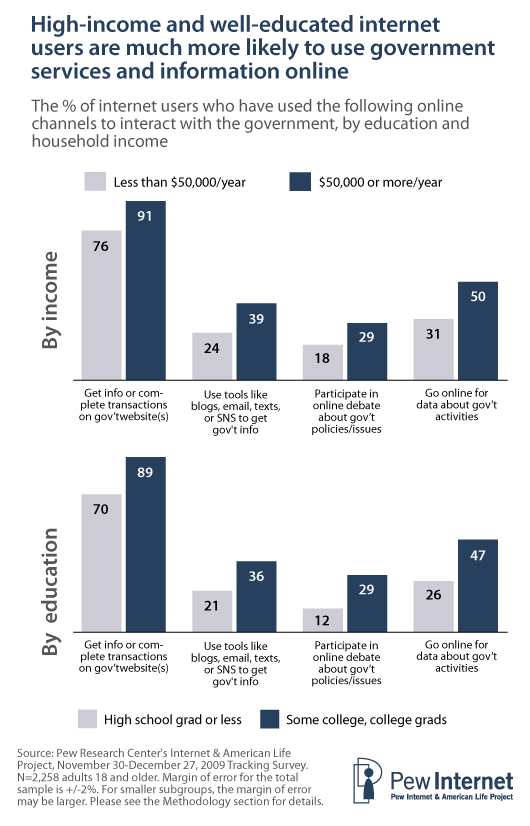
Use of government services and information online is most common among Americans with high incomes and education levels
While many Americans interact with government using online channels, this engagement is not evenly distributed across the online population—particularly when it comes to income and education. High-income and well-educated internet users are much more likely than those with lower levels of income and education to interact with government using many of the online channels we evaluated in our survey.
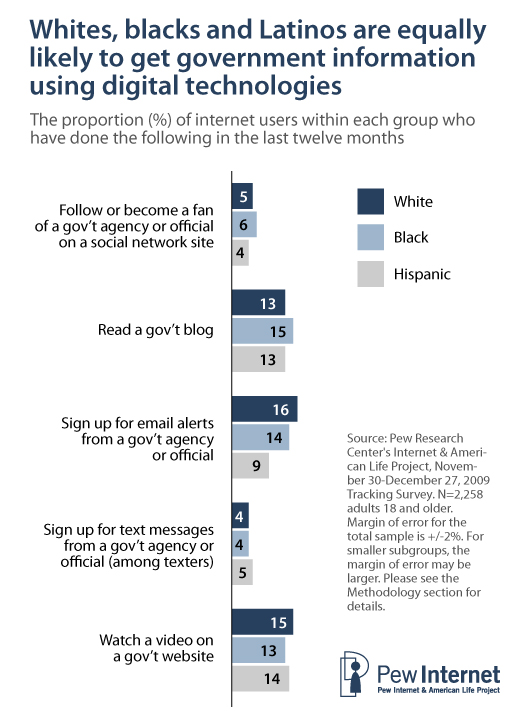
There are also racial differences in the use of online government services. Whites are significantly more likely than either African Americans or Latinos to participate in the online debate around government issues or policies (25% of online whites do this, compared with 14% of African Americans and Latinos) and are also much more likely to go online for data about government activities such as stimulus spending or campaign finance contributions (42% of online whites are what we call government data users, compared with 25% of blacks and 29% of Latinos). However, these differences are more modest when it comes to completing basic transactions and information searches on government websites, and minority internet users are just as likely as whites to get information about government agencies using tools such as email, blogs, online video or social networking sites.
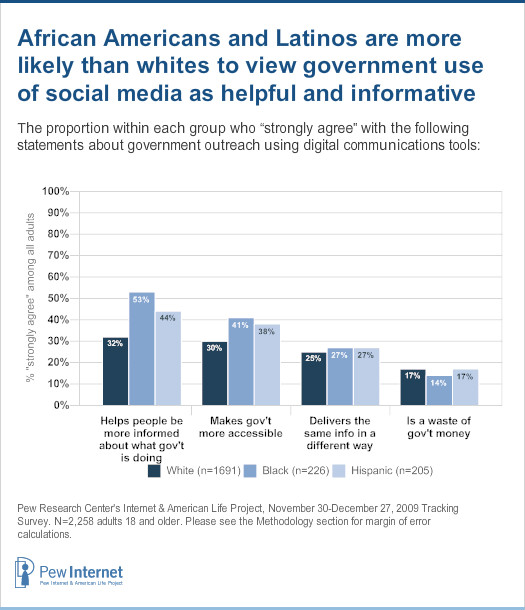
Government use of social media offers the potential to reach currently underserved populations, such as minority groups
As noted above, African Americans and Latinos are just as likely as whites to use tools such as blogs, social networking sites and online video to keep up with the workings of government. They also have very different attitudes towards the use of social media tools by government agencies and officials. Minority Americans are significantly more likely than whites to agree strongly with the statement that government outreach using tools such as blogs, social networking sites or text messaging “helps people be more informed about what the government is doing” and “makes government agencies and officials more accessible”.
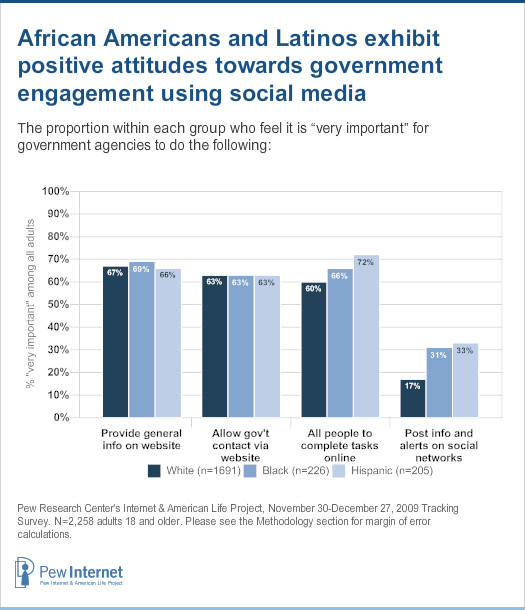
African Americans and Latinos are also much more likely than whites to say it is “very important” for government agencies to post information and alerts on sites such as Facebook and Twitter. Based on these users’ expressed attitudes, these tools may offer the ability for government agencies to reach underserved populations in a way that is not currently occurring with other online offerings.
These findings are discussed in more detail in Part 3.
Online Americans typically rely on search engines to guide them to their destination when seeking government information online
As we found in our previous studies on this topic, search engines are frequently the first option when Americans need to find government information or services online. Fully 44% of those who could remember the last government website they visited found that site by conducting an online search. This is much higher than the percentage who visited a site they had used before (16% did this) or who relied on a friend or family member (14%), a government publication or notice (11%) or a general government website such as usa.gov (4%).
The majority of online government interactions lead to a successful outcome
Government website visitors are also generally successful in solving their problems once they reach their online destination. Half of government website visitors said that they accomplished everything they set out to do in their last government website interaction, and an additional 28% were able to do most of what they wanted to do. Just 5% said that their most recent government website interaction was completely unsuccessful.
Americans tend to interact with government using a mix of online and offline methods. Internet users prefer contacting government online, but the telephone remains a key resource for government problem-solving
In this survey, we found that 44% of all Americans had contacted a government agency or official in the preceding twelve months via the telephone, a letter or in-person contact, and that these traditional methods are frequently used as a supplement to online information-seeking behavior. More than half of online government users have contacted government using offline as well as online methods.
The continued relevance of offline channels can also be seen in the way Americans prefer to interact with government agencies. Among the population as a whole, Americans are somewhat divided on their preferred method of contact when they have a problem or question that requires them to get in touch with government. Being able to call someone on the telephone is the most preferred option overall (35% said this) followed by contact via email or a website (28%) and in-person visits (20%). However, internet users prefer online contact to the telephone—although not by a large margin (37% vs. 33%). The technologically proficient (those with a home broadband connection and mobile internet users) and those who engage in a wide range of online government interactions more strongly prefer online contact to other means.
About This Survey
This report is based on the findings of a telephone survey conducted between November 30 and December 27, 2009, among a sample of 2,258 adults, age 18 and older. Interviews were conducted in both English (n=2,197) and Spanish (n=61) and a total of 565 interviews were conducted using the respondent’s cell phone. For results based on the total sample, one can say with 95% confidence that the error attributable to sampling and other random effects is plus or minus 2.4 percentage points. For results based Internet users (n=1,676), the margin of sampling error is plus or minus 2.8 percentage points.


