Overview
In the early 1980s, Americans started spending more time on the telephone. From 1980 to 1987, the number of minutes spent on the phone increased by 24%, three times the rate of population growth. At first, the reasons first seemed mysterious. Yes, fax machines were entering the workplace and the personal computing revolution was getting off the ground, both of which might have spurred growth voice traffic. But these factors were thought to account for no more than 10% of the growth.
The cause? The telephone answering machine. Although just 28% of homes had answering machines for their telephones in 1987, these new devices meant once-missed calls were returned and now-completed calls encouraged more phone calling.
This episode shows how relatively small changes in society’s technology portfolio in one area can have significant impacts in a related one. The answering machine served as an accelerant in to Americans’ existing calling patterns.6
In a similar way, mobile internet access is drawing people into more frequent online use. The information nugget initially discovered on the handheld device might prompt a user to open the laptop at home to explore further. Conversely, the fascinating blog post discovered on the desktop at home might be pursued further on the mobile device on the train to work and then taken along new pathways once online at the office.
This finding that mobile internet access is drawing people further into the digital world is the cornerstone of the Pew Internet Project’s second typology of information and communication technology (ICT) users.7 Some five groups in this typology – making up 39% of the adult population – have seen the frequency of their online use grow as their reliance on mobile devices has increased. Across those groups, there is a lot of variation on what these changes mean to users. Some find this extra connectivity a platform for self expression. Others are not entirely positive about ICTs’ impacts on their lives.
Then there is the other 61% of the adult population who do not feel the pull of mobility – or anything else – further into the digital world. Across the five groups that make up this part of the population, several have a lot of technology at hand and have seen their tech assets grow in recent years. Yet ICTs remain on the periphery in their lives, suggesting that some adult Americans reach a plateau in their technology use. Some groups are content with this distant relationship to technology. For others, even a little modern gadgetry is too much.
Building the Typology
The first Pew Internet Project user typology was constructed from a survey conducted from February 15 to April 16 in 2006. The survey for this typology was conducted from October 24 to December 2, 2007, about 20 months later. The second typology of information and communication technology (ICT) users builds upon the first in two ways. First, the same three pillars have been used to build the typology: users information assets, the actions they perform with the technology, and attitudes they have about the technology. In both surveys, respondents were asked whether they owned certain kinds of technology such as cell phones, broadband at home, MP3 players, digital cameras, video cameras, desktop computers, laptops, and others. Then they were asked what activities they performed and some of the activities-list questions were the same in both surveys. At the same time, we changed the list of online activities so that it covered some of the core topics that matter to the Pew Internet Project. For instance, people were asked whether they get news, health care information, and political news online in the 2007 survey, while these were not asked in the 2006 survey.
The 2007 survey also probed people’s use of their cell phones in ways different from 2006. In 2006, respondents were asked about the various capacities (e.g., to take a picture or record video) with some follow-up questions on whether they actually used those capabilities. In 2007, we asked more directly whether cell users had ever done a list of 10 actions on their cell phone and whether they had, on the prior day, done a given activity.
Most of the attitudinal questions from 2006 were repeated, such as measures on how people like the extra availability enabled by mobile devices, whether they need help with new gadgets and services, as well as questions about how difficult it would be for them to give up various ICT devices and services.
Second, the 2007 typology builds on the previous one through a callback survey of 2006 respondents. The 2006 typology survey contacted 4,001 respondents. The 2007 typology has 3,533 respondents drawn in part from a random digit dial survey of 2,054 adult Americans conducted from October 24, 2007 to December 2, 2007. Over the same time period in 2007, 1,499 respondents from the 2006 survey were contacted a second time.
It is important to underscore, however, that the 2007 typology is built solely on survey data from December 2007 – not the callback data. By looking at change in representative samples time – especially the groups’ attitudes toward mobile devices – we can state our key conclusion with confidence: Some groups are especially motivated to use technology by mobile connectivity because we see an improvement in attitudes about cell phones and associated increases in digital engagement.
The Typology and Longitudinal Analysis
The callback survey permits longitudinal analysis of respondents in the 20 months between the two surveys. This allows examination of what has changed, as far as information technology is concerned, in the lives of a broad sample of 1,499 Americans between May 2006 and December 2007. At a more granular level, combining longitudinal analysis with the typology’s classification of users offers a perspective on how change plays out across the typology’s groups.
Small changes generally, interesting variations when comparing the groups
Over the 20 months between the surveys, American adults in general acquired more ICTs, which in turn drew many of them deeper into internet use and fostered greater engagement with mobile devices. At the same time, there were in the aggregate only small changes in how people view ICTs’ impact on their personal productivity or on their competence in dealing with gadgets. Here are some illustrative data points, using data from the callback survey that contacted 1,499 adult Americans in 2006 and 2007. Because the respondents to the 2007 callback survey are a subsample of the sample of 3,554 adults used to build the typology, some of the percentages reported for the callback sample differ slightly from the sample used for the typology.
With respect to technology assets:
- Cell phones: In 2006, 73% of adults had a cell phone, a number that grew to 79% in 2007.
- Broadband at home: In 2006, 44% adults had a high-speed connection at home, a number that increased to 56% in 2007.
- Laptop computers: 31% of adults had a laptop in 2006, and 36% had one by the end of 2007.
- MP3 players: 19% of adults had an MP3 player or iPod in 2006 and 26% had one in 2007.
For activities with their ICTs:
- Going online “yesterday”: In 2006, 68% of online users said they had gone online the previous day; that figure grew to 74% in 2007.
- Going online from home: In 2006, 47% of internet users reported going online from home about once a day or more often. That number grew to 54% in 2007.
- Downloading music: In 2006, 23% of internet users had ever downloaded music, a number that rose to 30% in 2007.
- Paying for digital content: 22% of internet users had paid for digital content in the 2006 survey, compared with 26% in 2007.
- Downloading video: 18% of online users had ever downloaded a video from the internet in 2006; that number increased to 22% in 2007.
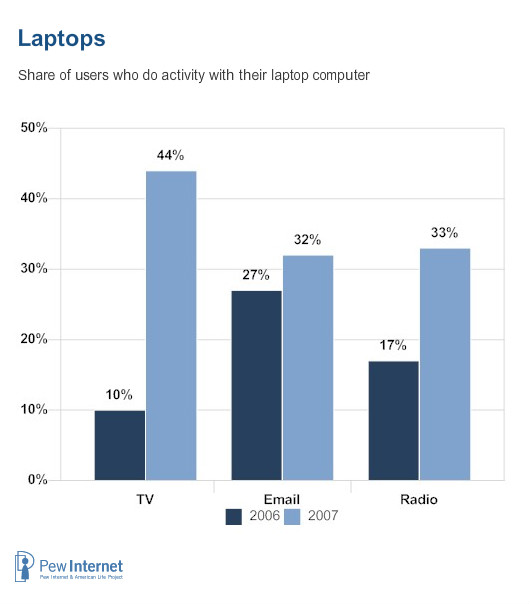
Accompanying the increase in cell phone and laptop adoption is a greater range of uses for them. In 2006, 27% of email users said they used their laptops to check email, a number that rose to 32% at the end of 2007. Among those who watch TV on a device other than a traditional television set, 44% used their laptop for this in 2007, up from 10% in 2006. Overall, 19% of adults had watched TV on a non-TV device in 2007, a growth from the 12% 2006 number.
For listening to the radio, although about the same share listened to radio programming on a device other than a traditional radio in 2007 and 2006 (about 25% in each year), how they did this changed. More used a laptop for this in 2007 than 2006 (by a 33% to 17% margin) and more used a MP3 player (30% in 2007 versus 17% in 2006).
Similarly, more people used their cell phones to take pictures or record video. Among those who take digital photos (a number that grew from 40% to 49% over the two surveys), 8% used their cell phone in 2006 and 22% used their cell phone in 2007 to take digital photos. For those who record their own video (a figure that declined from 26% in 2006 to 23% in 2007), more did this on a cell phone in 2007 than in 2006 by a 10% to 2% margin.
Changes in attitudes were more modest, with only people’s perspectives on ICT-enabled connectivity showing an increase of any magnitude. Somewhat more ICT users said they liked the additional availability that cell phones and other mobile devices allow them. In 2007, 76% agreed “a lot” or “somewhat” that they liked the additional availability, up from 71% in 2006. Other measures were unchanged. About the same number of gadget users said they needed help with new devices in 2007 as 2006 (48% and 47%, respectively), and the same pattern held true for the share saying they thought gadgets made them more productive (61% in 2007 and 60% in 2006).
Additionally, there were little or no changes in people’s attitudes about whether ICTs help them do their jobs, learn new things, or share their ideas and creations with others. Only for “keeping up with family and friends” was there any change, and it was not large. Some 81% of ICT users in 2007 said they agreed “a lot” or “somewhat” that their gadgets and services help them stay in touch with family and friends; this number was 77% in 2006.
Nonetheless, people were more likely in 2007 to say it would be “very” or “somewhat” hard to give up their cell phones or the internet. For cell phones, 69% of cell users said this in 2007, up from 61% who said this in 2006. For the internet, 74% of internet users said this in 2007 compared with 68% in 2006; for email, the figures were 73% and 69%, respectively.8
Within group variation
At a high level, there is a gentle deepening of people’s relationship to cyberspace, a moderate growth in welcoming its connectivity, and a growing reliance on mobile devices. Within the typology groups these patterns are more variable. The patterns within groups enable us to place the ten groups in the typology into two baskets that share key commonalities.
- Motivated by mobility: For five of the typology’s ten groups, or 39% of the adult population, growth in frequency of online use is linked not only to the growth in broadband adoption, but also to largely positive and improving attitudes about how mobile devices make them more available to others.
- Stationary media majority: For the remaining four typology groups with modern ICTs (and, by default, the fifth group that lacks internet or cell access), the internet and mobile access do not play much of a role in their lives. And that disposition isn’t changing for people in these groups, even for those in several of the groups that have experienced growth in broadband adoption. These groups comprise 61% of the adult population.
Groups that are motivated by mobility show an increase in frequency of internet use from 2006 to 2007, which is also accompanied by greater reliance on their mobile devices. These groups say it would be very hard to give up their cell phone. In the 2007 sample, they also record high levels of use of their cell phones for non-voice data applications such as text messaging and internet browsing. The five groups reliant on traditional media tools, even in the face of growing high-speed adoption at home, show no growth (or declines) in the frequency of online use, low levels of use of mobile applications, and decidedly tepid attitudes about ICTs.
Although the groups in the two baskets share some characteristics, each group makes a distinct imprint with its disposition toward ICTs. Some could love them or leave them, others couldn’t do without them, and others would rather do without them, but don’t.


