Introduction
Broadband adoption in the United States continues to exhibit steady growth, with 17% more American adults having broadband at home in April 2008 than was the case roughly a year earlier. Fully 55% of Americans reported having a high-speed internet connection at home in our April survey, up from 47% in March 2007. The share of Americans with broadband at home in our April 2008 survey is little changed from the 54% of Americans who said they had broadband at home in our December 2007 survey.
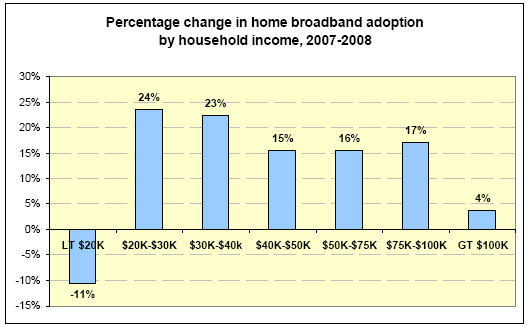
The chart below shows growth rates in broadband adoption in recent years.
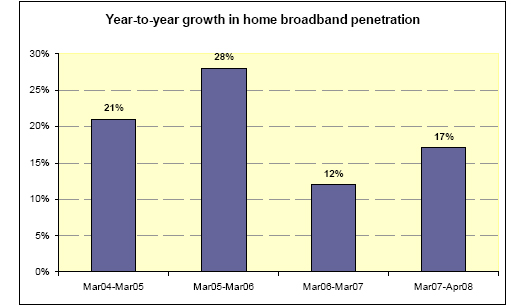
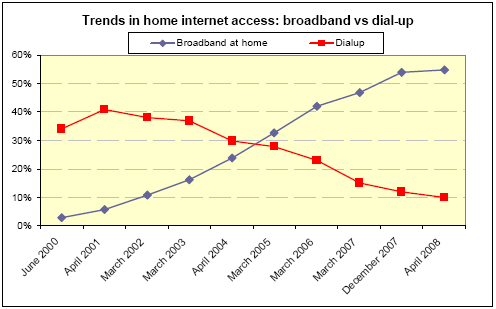
This highpoint in our surveys for home broadband adoption also marks a low in the use of dial-up as a way to access the internet. Just 10% of American adults say they use dial-up internet connections at home to go online.
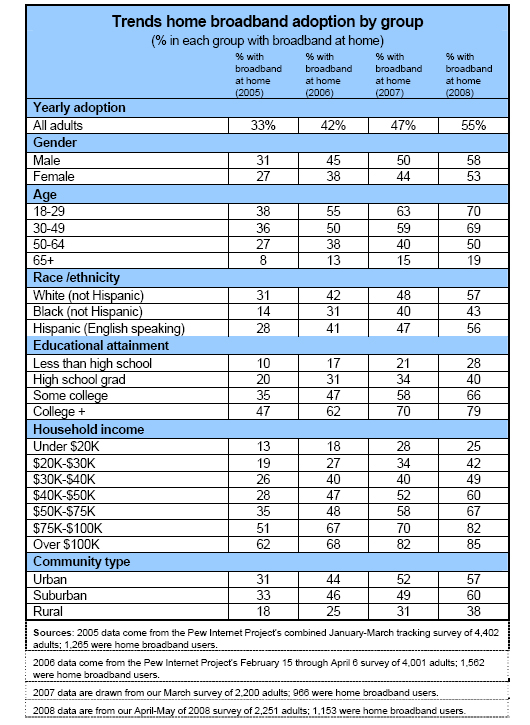
Although growth in broadband adoption from 2007 to 2008 was comparable to the 2006-2007 timeframe, the sources of recent growth differ from prior years. Over the past year, growth in broadband adoption at home was strong among lower-middle income Americans, and those over the age of 50. However, several groups that had shown strong rates of broadband uptake in past years slowed in the 2007-2008 timeframe. Specifically:
- Low-income Americans – defined as those who say their annual household incomes are $20,000 or below. This group showed a change in adoption from 28% in 2007 to 25% in 2008. This recorded decline in broadband adoption is within the margin of error for the surveys, suggesting that adoption was basically flat in this group. Some 14% of the sample reported having an annual household income at $20,000 or less.
- African Americans: The share of African-Americans with broadband at home increased from 40% to 43% from 2007 to 2008. This change is also within the margin of error for the surveys, suggesting little or no growth in broadband adoption for African Americans from 2007 to 2008.
- Urban dwellers: Although 57% of those in urban areas have broadband at home, this represented a growth of 10% from the 2007 level.
- Upper–income Americans: Among those living in households with annual incomes in excess of $100,000, broadband adoption grew from 82% to 85% from 2007 to 2008. This is a modest 4% growth rate at penetration levels nearing saturation.
These slow or flat growth rates were compensated by faster growth in broadband adoption in two sizable (and not mutually exclusive) groups of Americans:
- Older Americans: Respondents age 50 and over, which make up 43% of the entire sample, reported a 26% growth in broadband adoption from 2007 to 2008. Half (50%) of those in the 50 through 64 age bracket had broadband at home by April 2008 and 19% of senior citizens (those 65 and older) did.
- Suburban and Rural Americans: These two regions – two-thirds of the adult population – registered a 22% increase in broadband adoption from 2007 to 2008. Fully 60% of suburbanites and 38% of rural residents reported having broadband at home in our 2008 survey.
It is also worth noting that some 28% of respondents who have not completed high school said they have broadband at home in 2008, a 33% increase relative to 2007. This growth rate applies to a group that made up 13% of the sample.
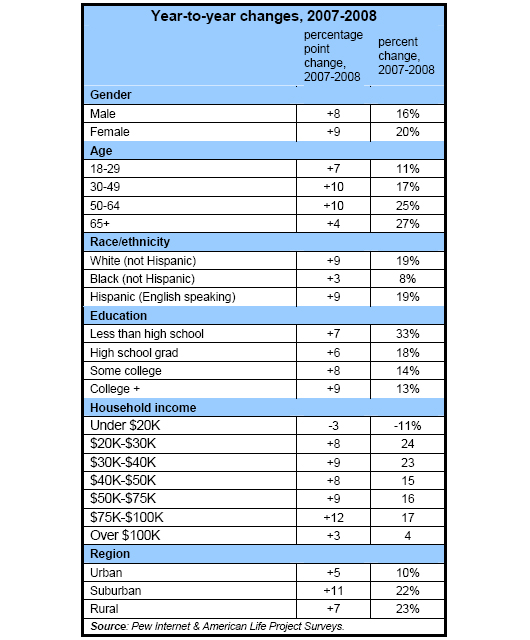
The chart below displays the growth rates from 2007 to 2008 across the disaggregated income categories. The figures at either end of the income distribution show poor performance among low income Americans and little growth among upper income Americans; broadband adoption grew from 82% to 85% from 2007 to 2008 in households with annual incomes above $100,000. Broadband adoption is approaching a saturation point for upper income Americans.
Many respondents do not tell us what their income is, but they do share whether they have high-speed connections at home. Among the roughly 20% of respondents who refuse to answer the income question, 34% had broadband connections at home in 2007; for respondents from our 2008 survey who did not provide information on income 41% had broadband at home. This is a growth rate of 21% from 2007 to 2008.
Fixed wireless has greater role in the home broadband market.
When asking people about their online connection speed, the survey question reads: “Does the computer you use at home connect to the internet through a dial-up telephone line, or do you have some other type of connection, such as a DSL-enabled phone line, a cable TV modem, a wireless connection, or a T-1 or fiber optic connection?” This yields not only whether people have broadband connections at home, but also the type of connection they use.
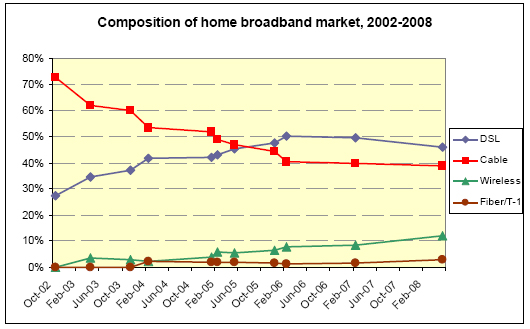
DSL providers maintain an edge in the home broadband market, with 46% of home broadband users saying they subscribe to DSL and 39% saying they have cable modem service. As a home high-speed connection, wireless has also increased its presence – from next to nothing in 2002 up to 12% of the home broadband market as of May 2008.
A handful (2%) of home broadband users has fiber optic connections.
Our May 2008 survey marked the first time respondents were asked whether they have fiber optic connections to the internet in their homes. Providers such as Verizon, with its FiOS service, have been marketing such connections that promise much faster upload and download speeds than DSL or cable. In the April 2008 survey, 2% of home broadband users said they had a fiber optic connection to the internet.
A few suburban broadband users are starting to get fiber at home, while some rural broadband users rely on satellite for broadband.
When comparing the type of broadband connections users choose by the kinds of places people live, some rural users rely on satellite – perhaps because they lack wired infrastructure where they live. By contrast, 4% of suburban broadband users say they have fiber to the home – and this makes up the strong majority of all fiber connections at home reported by respondents in this survey.
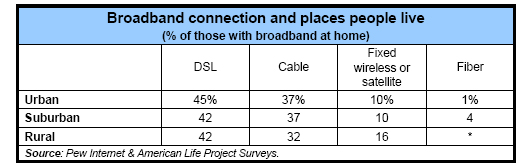
Note that in the chart with aggregate trends in connection type, the lowest line combines T-1 and fiber optic connections reported by users. In the “fiber” column in the table above, figures show only the percentage in each category who specifically said they have a fiber optic connection at home.
Broadband is 4% cheaper than in 2005.
In the past, our surveys have asked what people pay per month for internet access; we last did this in December 2005. The April 2008 survey had different question wording to reflect that some people have internet service bundled with phone or cable service and, if so, most likely have a single bill for several services. Thus, the question wording in the April 2008 survey was:
“To the nearest dollar, about how much do you pay each month for internet access at home? If your internet access is combined with television or other services, I would like to know just the amount you pay for internet service.”
Overall, home broadband users reported that their monthly payment for internet service was $34.50 – 4% less than the figure of $36 per month reported in December 2005.3 This decline in monthly broadband bills is half the rate (8%) reported over the February 2004 to December 2005 timeframe.
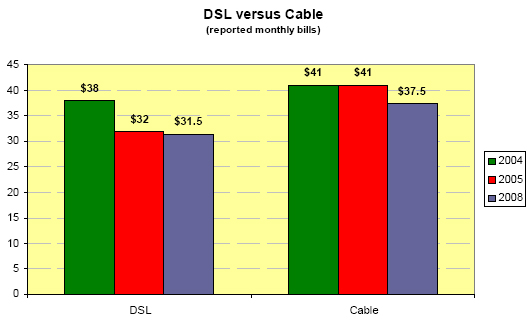
As in 2005, there is a gap in what people pay for cable modem service compared to DSL, although it is narrower today than a few years ago. In December 2005, cable modem users reported monthly bills of $41 for service, while DSL users said they paid $32 per month for service. In May 2008, DSL users reported monthly internet access bills of $31.5 and cable modem users said they paid $37.5 for service, or an average difference of $6.
For dial-up users, the story was different. Their monthly access bill was $19.70 – 9% higher than the figure of $18 that dial-up users reported in December 2005.
Some broadband users pay for premium services.
One possible reason that users’ monthly broadband bills did not fall as fast from 2005 to 2008 as was the case in the 2004-05 interval is the existence of pricier premium service. Most (54%) of broadband users say they subscribe to basic broadband service, but nearly one-third (29%) say they subscribe to a premium service at a higher price. The survey specifically asked users whether they subscribe to a basic broadband service or if they pay extra for a premium service that promises faster speed.4
Here is how monthly costs differ for premium versus non-premium services:
- Subscribers to a premium broadband service report a monthly bill of $38 for their internet service.
- Subscribers to basic home broadband service report a monthly bill of $33 for their internet service.
People are likely to cite faster access speeds as the thing they like most about broadband, but few people actually know the speed of their connections.
Broadband users clearly like the faster access to content on the internet that their home high-speed connection affords them. When asked what they like most about having a broadband connection, 75% of home high-speed users cited faster access or greater speed. Other uses cited as the feature valued most included the “always on”’ connection (cited by 6% of broadband users), convenience (5%), job-related tasks (4%), downloading files of all types (3%), and finding educational materials (2%).
This is not to say that broadband users don’t value specific applications listed above (and others such as gaming and entertainment) that a high-speed connection enables. It is just that the broad notion of faster access speeds came to mind most often for respondents.
