Introduction
In the past few years, the growing number of Americans living in households without landline telephones has challenged survey researchers to develop a variety of approaches to deal with this non-coverage issue. One approach is to add interviews over the cell phone to traditional random digit dial surveys of landline telephones.1
Adding cell phone interviews attempts to include people who cannot be interviewed via landlines, i.e. those without landline phones, particularly younger Americans. The major reason this is done is to seek as complete coverage of the population as possible. The secondary reason for these efforts (which can add substantially to the costs of surveys) is that those who are not covered may, in fact, differ from those reachable via landline on the key variables being studied. Findings from the National Health Interview Survey have provided a detailed look at the issue.2 The contrary situation – where those who are interviewed via cell phone do not differ from those interviewed via landline on the key variables – would suggest that the added cost of cell phone interviews might not be necessary and the non-coverage issues could be addressed in other ways.
Both conducting these cell phone interviews and adding them to landline surveys pose a variety of operational, methodological and practical issues. These issues are important and unsolved problems remain.
Since most Americans have cell phones and most still have landline phones in their homes, there is major overlap between those one can be reached on a landline phone and on a cell phone. One approach to adding cell phone interviews has been to screen adult respondents reached via cell phone to those who have no landline phone at home, the so-called Cell Phone Only samples (CPO). Thus, in theory, the sampling frame for the CPO sample does not overlap with the sampling frame for the landline sample. Another approach is to interview all adults reached via cell phone, while still determining if they have a landline phone at home. Using this approach, some of the cell phone interviews are CPO and some are not.
The purpose of this paper is look at the implications of adding cell phone interviews to surveys in terms of the differences between the landline interviews and the cell phone interviews on a group of key parameters: Americans involvement with, use of and attitudes toward the internet. The major methodological questions raised by cell phone interviews are not addressed in this paper, for they are covered in other papers at the AAPOR conference in New Orleans in 2008. This paper’s findings do raise one possible methodological complication that may need further exploration.
The Survey
This paper is based on data collected for the 2007 Annual Gadgets survey for the Pew Internet & American Life project. PIAL has, for the past eight years studied in the growth and impact of the internet from the viewpoint of the average user. The project is now one of the main, trusted sources for information about the shape, depth and impact of the Internet on the nation’s life. This survey was designed to inventory Americans’ usage of the internet and ownership of various electronic devices that access the internet in one way or another. It is a complex survey, including a standard landline RDD sample, an RDD sample of cell phone users and a callback survey of those interviewed in the 2006 Gadget survey.10
The central reason for adding cell phone interviews to this survey is that others have shown that young people are more likely to not live in a household with a landline and to depend completely on their cell phone. Since the PIAL work has shown that young people are heavier users of the internet along many dimensions, a significant issue of non-coverage of young people could have implications for the project’s overall estimates of internet use, activities and attitudes.
This report considers only the RDD samples of landline phones and the RDD sample of cell phones. A total of 1,554 interviews were completed with the landline sample. A total of 500 interviews were completed with the cell phone sample. In general for this report, the results of each sample are compared on a weighted basis, using the correct weight for each sample. Where the overall combined results of both the landline and cell phone results are mentioned, weighted numbers are also reported, using the weights appropriate to that combined sample.11
How The Samples Differ . . . Or Not
As expected, the cell phone population is considerably younger than the landline sample on average. The mean age of the cell phone sample was 37; it was 49 for the landline sample.12 A total of 41% of the cell sample was age 18-30, compared with 22 % of the landline sample. In the landline sample, 21% were age 62 and up, compared with 6% for the cell interviews. In addition, the percentage of males in the cell phone sample was greater than in the landline sample:
- Cell phone: 54% male – 46% female
- Landline: 48% male – 52% female
By income, there are few significant differences, although the landline interviews have a higher refusal rate on the income question than the cell phone interviews (19% v. 12%). By education, there were also significant differences between samples.
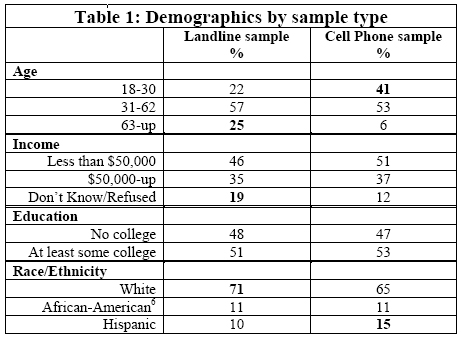
* “African-American” refers to non-Hispanic African-Americans
The differences in current education level do mask another difference: respondents in the cell phone sample were more likely to report being students, both full-time and part-time (24% cellphone v. 13% landline)13.
And surprisingly, both samples includes the same percentage of those who say they have a child age 18 years or younger at home – 33% in each.
One possible concern about these two different samples is that though they look somewhat similar on some demographic measures, these similarities might mask substantial differences in what they do every day. This research does not provide a definitive answer to that question.14 However, there are several indicators that suggest the samples are similar in daily behavior. For instance, the respondents from each sample report similar patterns of frequency in watching television and in listening to music or radio shows. They report similar frequencies of taking digital photos and making videos. These are all gadget-related activities (unsurprising, given the topic of the survey), but the lack of differences between the samples provides some additional evidence that the samples are not wildly different.
The Central Question
In a relatively short time, the internet has moved from a technological curiosity to a central place in daily American life. Three-quarters of Americans (75%) now have access to the internet, either at home or at work.15 Factors most closely related to internet access are age, income and education. The interrelationship of the factors is complex: young people, whatever their income, are much more likely to have internet access than older Americans. Ninety-two percent of those age 18-30 (Gen Y or Millennials) have internet access, compared with 42% of those age 62 and older (the Matures). Income and education also relate to higher levels of internet access, if less strongly than age.
Cell phone use follows a somewhat similar pattern to internet use in terms of age, with nearly nine in 10 of those age 18-30 (88%) having a cell phone, compared with just over half of those age 65 and older (54%). Cell phone use also increases with income and with educational levels. There is major overlap between cell phone ownership and internet access: 85% of the internet users have cell phones, compared with only 45% of those who do not use the internet.
The Results: Basic Internet Use
Given the importance of age in both internet use and cell phone use, the key hypothesis is simple: those interviewed via cell phone are different, in terms of their internet use, behavior and attitudes, from those who are interviewed via landlines. And the expectation is that those interviewed via cell phone will be more intensive users of the internet.
At least initially, the topline results turned out as expected. Those in the cell phone sample were more likely to report use of the internet than those in the landline sample (86% v. 76%) and more likely to report the use of a computer (86% v. 76%).16 The differences in internet use are almost entirely a result of the demographic differences between the samples, principally age.
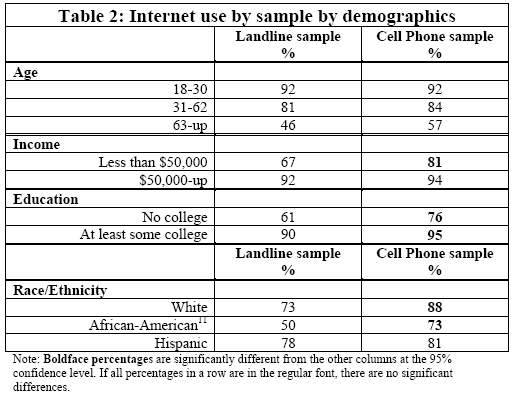
Note: “African Americans” refers to non-Hispanic African Americans.
The first interesting point is that there are no significant differences between the samples within each age level. All the differences are between the age levels. Thus, a major force in the differing levels of internet use in the two samples is the different age profiles of the samples. (Unless the numbers are in bold face, there are no significant differences between the columns.) The differences by income group and educational level are generally significant, but further analysis suggests that these differences arise principally from the age differentials between the samples. The differences among the racial and ethnic groups also arise primarily from the differing age profiles of the samples and of the groups themselves.
On other indicators of internet use, there are fewer differences between the samples. For example, there are no differences between the samples in whether the users went online yesterday (73% of both groups did so). This is a key indicator of intensity of internet use that PIAL has used for many years. Nor are there any significant differences in how long members ofeach sample have been using the internet.
The frequency of internet use at home and at work also do not exhibit differences. Those in the cell phone sample are more likely to say they have used the internet or email some place other than home and work: 30% of the cell sample have done so in the last week, versus 18% of the landline group.
One area with some differences is how the internet is accessed from home. Those with landline sample are more likely to report still having dial-up access at home (19% v. 14%). Thus, those with landline access are less likely to report high-speed access at home (77% v. 81%). The major difference is that 16% of the cell sample say they have wireless high-speed internet access at home, versus 8% of the landline sample.
The Results: Online Behavior and Activities
If those interviewed on the cell phone are more likely to use the internet, do they behave differently in significant ways when they are online? The important distinction here is that the base for the analysis is no longer all adults: now the base for results is the adults in each sample who have internet access. This base of internet users does display demographic differences between the samples, but the gaps are somewhat smaller than when looking at all adults. For example, the mean age of the internet users from the landline sample is 44 years, versus 36 years for the cell phone sample.
Over the past eight years, the Pew Internet Project has used a series of questions covering various types of internet activities, from sending email and checking the sports scores to buying books online and downloading podcasts. This Web Activities series of questions provides a consistent reading on online behavior over time, often with results that include whether the behavior occurred yesterday. In this survey, two of the activities show no differences by sample type: sending and receiving email and seeking health and medical information online.
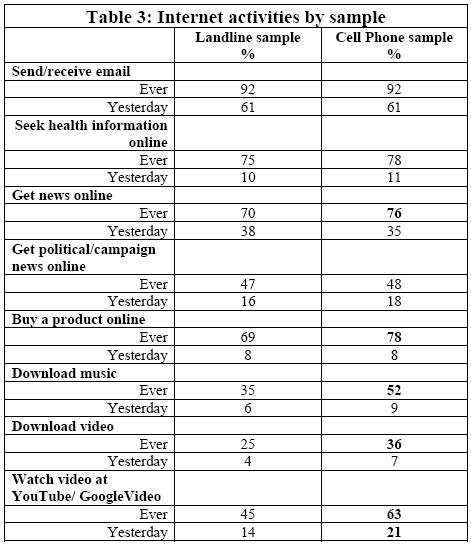
But several activities do show significant differences: for example, those in the cell sample are more likely to get news online (76%) than those internet users from the landline sample (70%). For other online activities, more internet behavior is reported and it is sometimes more intense. For example, nearly two-thirds of the cell sample (63%) say they watch video online at a site like YouTube or GoogleVideo, versus 45% of the landline sample. And fully one in five of the cell sample (21%) say they did this yesterday, compared with one in seven of the landline sample (14%). For all these activities, the younger skew of the cell sample is the largest factor responsible for the differences in behavior.
Social networking sites such as MySpace and Facebook have exploded in popularity, for many reasons, and much of that growth has come among younger Americans. This is reflected in this survey and in differences between the sample types. Only 30% of those interviewed on landline say they have an online profile on one of these sites, while 44% of those interviewed via cell phone report putting up such a profile. That difference is driven substantially by the difference between the samples among the younger users, age 18-30: 75% of the cell phone sample in this age group have a profile, compared with 62% of the land line sample.
The Results: More Likely To Create Online
An area of explosive growth online is the ability to create content and put it online, whether a blog, a webpage, a video or a mash-up of one’s own data and a Google map. From earlier PIAL work, we know that these activities are generally low incidence and that those who create and post content skew toward younger internet users. For this survey, these patterns are evident and, generally, one finds somewhat greater activity reported from those in the cell phone sample. Given the low incidences of these behaviors, finding statistically significant differences is somewhat less common, although the differences that are found are in the expected directions.
For example, 18% of the cell phone sample report creating or working on one’s own blog, while only 11% of the land sample does the same. This significant difference appears to be largely the result of the young people in cell phone sample: 30% of those age 18-30 in cell phone sample has a blog versus 20% of the same age group in the landline sample. This difference is not statistically significant, but it is what is expected.
Likewise, sharing something online that you created yourself, such as your own artwork, photos, stories or videos is reported by 29% of those in the cell phone sample and only 19% in the landline sample. Again, among those age 18-30, 42% of the cell phone have done this, compared with 29% of the landline sample. This difference is significant at the 90% level.
But there are creative online activities where the sample does not seem to make a difference. For example, creating your own web page is reported by 15% of the cell phone sample and 14% of the landline sample. Likewise, creating or editing a webpage for someone else is cited by 13% of the landline sample and 15% of the cell phone sample. And there are no significant differences by sample type in sharing your digital photos through email (70% landline, 71% cell phone) or posting your photos online (33% landline, 37% cell phone).
In contrast, there are significant differences between samples in sharing your own videos on DVD (44% landline, 58% cell phone) or via email (17% landline, 41% cell phone).
The Results: Those Age 18-30
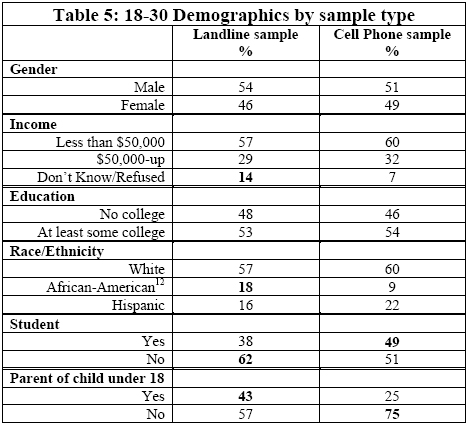
It should be clear from the discussion thus far that the samples of young adults (those age 18-30) interviewed via landline and via cell phone do differ on a number of dimensions, both demographically and in terms of behavior online.
The differences by demographics in this age group are interesting and significant in terms of reaching populations who are under-represented in standard landline RDD surveys. But the most telling differences come in two other categories. First, the cell phone interviewees are much more likely to be students, either full-time or part-time, than those interviewed by landline (49%- 38%). Second, those interviewed by landline are much more likely to have a child under 18 living at home with them, compared with those who are interviewed by cell (43%-25%).
In terms of internet access, as we have already seen, there is no difference between the samples: 92% of each sample in this age group are internet users. In terms of what they do online, these young adult internet users do vary substantially by sample, a reflection, at least in part of where exactly they are in their life’s journey at this young age.
Table 6 is a shortened version of Table 3 and limited only to those age 18-30. There is no difference between the samples in this age range in their use of email, but for most of the other behaviors, the cell sample is more active online.
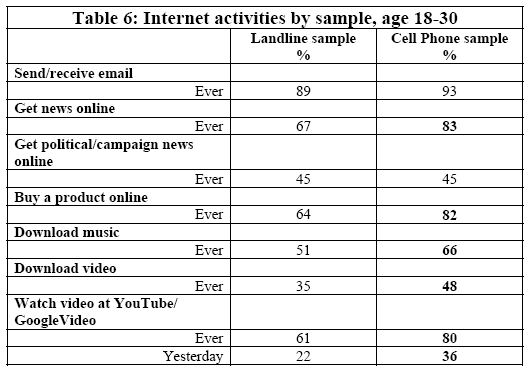
Earlier, it was noted that in the total survey, all internet users in the cell sample are more likely to get news online (76%) than those internet users from the landline sample (70%). To some, this might be surprising, since younger Americans are well-known for their lack of interest in picking up a daily newspaper for the day’s news. But the flip side of this behavior about young people is that they do seek out news . . . only they do it online. And this is particularly true for those interviewed on their cell phones. Overall, 74% of those age 18-30 in this survey say they read news online. In this survey, that percentage is 83% for the cell sample and 67% for the landline sample. This difference may well explain why this youngest group of internet users has seemed to have a lower news consumption rate than those just older (age 31-42): the youngest people who seek news online can best be reached by cell phone.
And this contrasts to the use of the internet for political or campaign news: there is no difference by sample. This may be a reflection of the intervening factor that political interest plays in this online behavior.
The Results: A Possible Methodological Challenge
Interviewing all adults available by cell phone is more efficient than interviewing only those who have no landline phone at home, simply because the screening of cell phone respondents then includes only age, not age plus phone availability. The objection to interviewing all adults available via cell phone is that some of those adults are now reachable two different ways, via landline and via cell phone. As mentioned above, these thorny methodological issues are addressed elsewhere.
For this survey, the cell phone interviews divided, with 52% saying they have no landline phone at home and 48% of the cell phone respondents saying they do have a landline phone at home.17
The possible methodological challenge that could be suggested by this data is that having a landline phone may no longer mean using a landline phone.
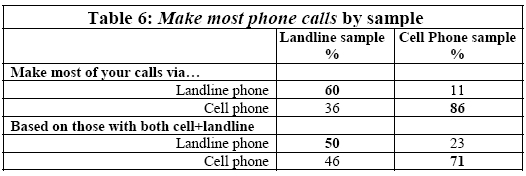
Thus, even though 48% of the cell phone sample have a landline and could use their landline for most of their calls, 71% of them still make most of their calls on the cell phone.
And conversely, those interviewed on their landline who also have a cell phone split almost evenly 50-46 in terms of which mode they use for most of their calls. This again, suggests that a substantial portion of the landline sample is actually more reachable on their cell phone than on their landline.
If one takes these numbers to a logical conclusion, there are many Americans who have landline phones, but they are more reachable on their cell phones. If this conclusion is found to be accurate over time, more and more interviews will need to be done using cell phone samples.
Conclusions
The purpose of this paper is to examine the implications of adding cell phone interviews to surveys in terms of the differences between the landline interviews and the cell phone interviews on a group of key parameters: Americans involvement with, use of and attitudes toward the internet. As has been discussed, those interviewed on cell phones are more likely to have internet access and are more likely to report more activities online than internet users interviewed via landline phones. Some of these differences are a result of the younger age distribution among those interviewed via cell phone. But many of the differences are due, at least in part, to reaching these respondents on their cell phones, whether or not the cell phone is their only telephone. These findings suggest that for surveys where the key variables are related to age, and particularly where data on younger adults is important, that cell phone interviewing makes a difference in the findings. And the findings also raise the question of whether the increased reliance on cell phones by all Americans does not imply a need to add cell phone interviewing to all major national surveys.


