The results in this report are based on data from telephone interviews conducted by Princeton Survey Research Associates International between August 3 to September 5, 2007, among a sample of 2,400 adults, 18 and older. For results based on the total sample, one can say with 95% confidence that the error attributable to sampling is plus or minus 2.3 percentage points. For results based on internet users (n=1,684), the margin of sampling error is plus or minus 2.7 percentage points. In addition to sampling error, question wording and practical difficulties in conducting telephone surveys may introduce some error or bias into the findings of opinion polls.
Interviews were conducted using a dual-frame sample design. Both landline and cellular random-digit dial (RDD) samples were used. A total of 2,271 interviews were conducted from RDD landline sample and the remaining 129 interviews were conducted by calling RDD cellular sample.
The landline sample for this survey is a list-assisted random digit sample of telephone numbers selected from landline telephone exchanges in the continental United States. The random digit aspect of the sample is used to avoid “listing” bias and provides representation of both listed and unlisted numbers (including not-yet-listed numbers). The design of the sample achieves this representation by random generation of the last two digits of telephone numbers selected on the basis of their area code, telephone exchange, and bank number.
The cell phone sample is also RDD and is drawn from dedicated cellular exchanges based on the most recently available Telcordia TPM (Terminating Point Master) Data file. Since there is no source or list of assigned cellular telephone numbers, the cell phone sample is not list assisted.
In each contacted landline household, interviewers asked to speak with the youngest male currently at home. If no male was available, interviewers asked to speak with the youngest female at home. This systematic respondent selection technique has been shown to produce samples that closely mirror the population in terms of age and gender.
For the cell phone sample, interviews were conducted with whoever answered the cell phone as long as they were an adult. Voicemail messages were left only one time giving some information about the study and providing a toll-free number that people could call to conduct an interview at their convenience.
Sample was released for interviewing in replicates, which are representative subsamples of the larger sample. Using replicates to control the release of sample ensures that complete call procedures are followed for the entire sample. At least 10 attempts were made to complete an interview for each sampled phone number. Calls were staggered over times of day and days of the week to maximize the chance of making contact with potential respondents. Each sampled phone number received at least one daytime call in an attempt to make contact with a respondent.
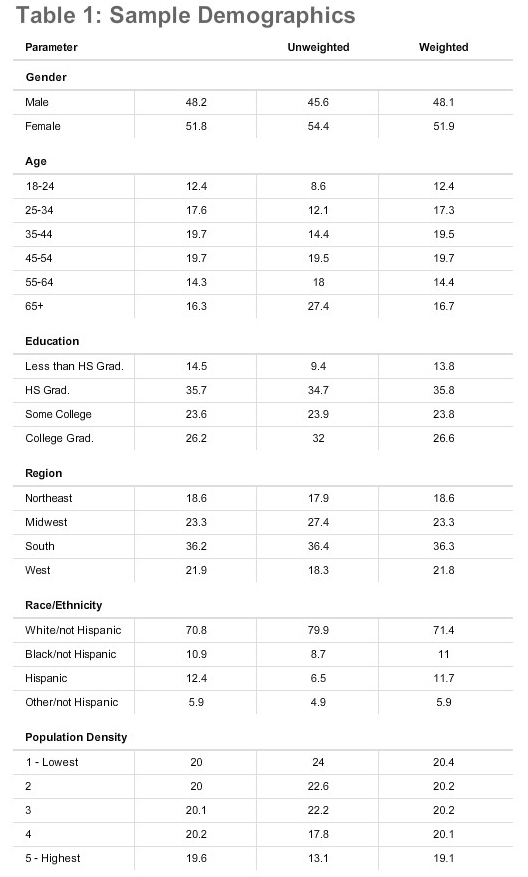
The data was weighted to help correct for potential bias that might be introduced due to non-response and to account for the dual-frame sample design. The demographic weighting parameters are derived from a special analysis of the Census Bureau’s March 2006 Annual Social and Economic Supplement Survey. This analysis produces population parameters for the demographic characteristics of adults age 18 or older living in the continental United States. One weighting parameter – phone use – was taken from the 2005 U.S. Consumer Expenditure Survey. The weights are derived using an iterative technique that simultaneously balances the distribution of all weighting parameters. Table 1 compares unweighted and weighted sample distributions to population parameters.
Following is the full disposition of all sampled telephone numbers:
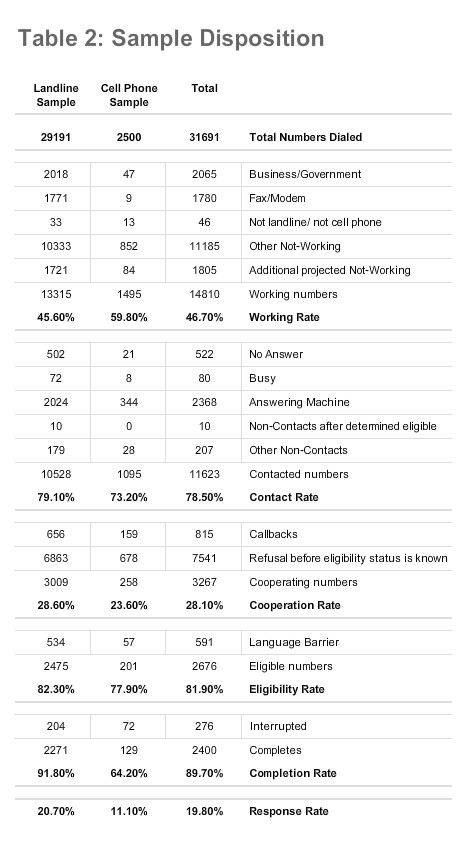
PSRAI calculates a response rate as the product of three individual rates: the contact rate, the cooperation rate, and the completion rate. Of the working phone numbers in the combined sample (landline plus cell phone), 78 percent were contacted by an interviewer and 28 percent agreed to participate in the survey. Eighty-two percent were found eligible for the interview. Furthermore, 90 percent of eligible respondents completed the interview. Therefore, the final response rate is 20 percent.


