Introduction
The development of the typology itself did not include demographic factors. A person’s gender, race, income, or educational level did not determine the group in which someone was slotted. In prior sections, the discussion of the demographic make up of each group sought to fill out the portrait of the typical member of each group.
However, patterns emerge when looking at the groups and demographic or economic variables. Some of this is entirely understandable; the typology depends in part on the technology people have, which in turn depends a great deal on income levels. Other patterns shed interesting light on patterns of technology adoption.
It is important to note that the demographic patterns reported in this section show tendencies, but are not meant to convey a deterministic flavor in the typology. For example, although the most extensive ICT users tend to be young males, this does not mean that all such users have these characteristics. The report’s Appendix contains tables with detailed demographic data on each of the then groups.
Gender
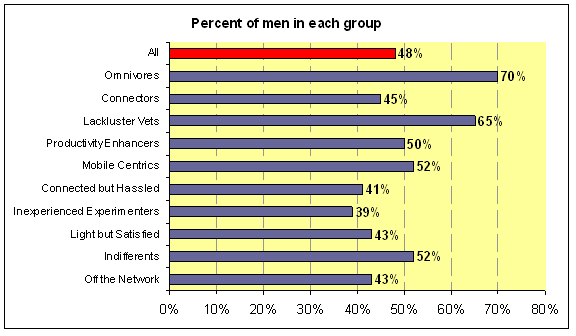
The high-tech groups tend to be dominated by men, but there are only small gender differences when it comes to cell phone use. Of the four technology-oriented groups, two of them have men out numbering women by a two to one ratio, with one having a majority of women and the fourth evenly split. However, Connectors, with 55% women, has 100% cell phone adoption (unlike the other two male-dominated groups) and are extensive users of cell phones and their non-voice features.
The two middle tech groups consist of one with a slight majority of males, with the other having nearly 60% women. The four “low tech” groups have mostly women, although one is majority male. The chart below displays the share of men and women across each of the groups.
Income
Although those with higher incomes generally have more ICTs, some mid- or low-tech groups have a sizable share of people living in households whose income exceeds $75,000 annually. This suggests income is not a wholly dominant factor in adoption.
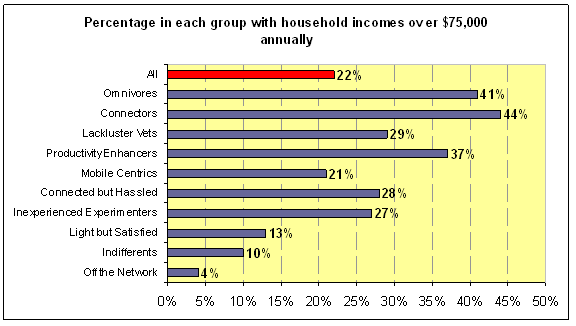
The comfortable income levels for several mid-range tech groups suggest that preferences play a role in technology adoption that is separate and apart from income. These mid-range groups, with incomes nearly matching tech-oriented groups, could purchase more gadgets, but do not. Conversely, not all members of tech-oriented groups are wealthy, yet they acquire information goods and services anyway.
Education
A person’s educational level is tied to economic status, but in the context of technology adoption, it plays another role. Exposure to and use of broadband, wireless, and other information technologies often happens at school. The table shows how tech-oriented groups generally have higher levels of education.
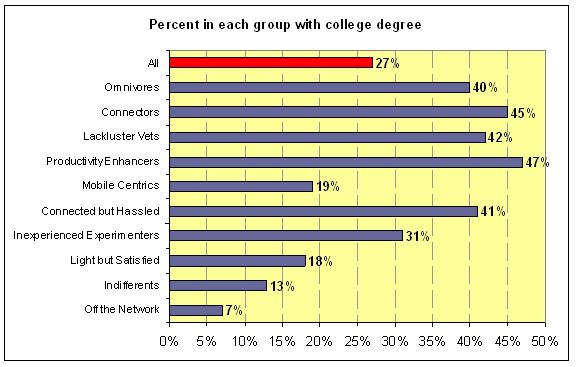
High levels of education may not always mean a person enjoys using information technology. The Lackluster Veterans group has a high share of people with college degrees, but also a large share of people reporting information overload and stress from managing their technology gadgets. It is also worth noting that two of the four tech-oriented groups have a higher-than-average percentage of members who are full or part-time students (see Appendix for details).
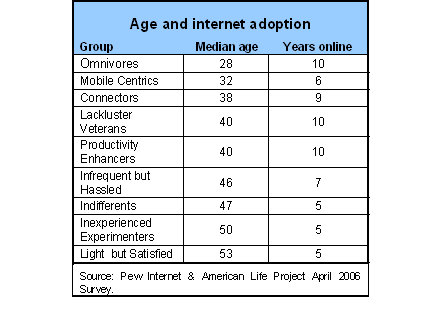
Age
The typology clearly shows how modern information technology is the province of youth. Yet, overlaying age with the number of years online tenure shows that technology adoption unfolds in waves within age cohorts. The table below displays the groups by the median number of years they have been online, next to the median age of the group.