Schools-related questions in the survey
Final Topline, 12/14/04
Data for October 26 – November 28, 2004
Princeton Survey Research Associates International for the Pew Internet & American Life Project
[971 online teens, 129 offline teens]
Interviewing dates: 10.26.04 – 11.28.04
- Margin of error is plus or minus 3 percentage points for results based on parents
- Margin of error is plus or minus 4 percentage points for results based on parents of online teens
- Margin of error is plus or minus 3 percentage points for results based on teens
- Margin of error is plus or minus 4 percentage points for results based on online teens
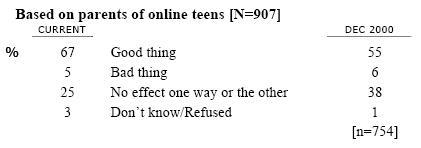
[N=1,100]
Q22 Overall, do you think that email and the Internet have been a GOOD thing for your child, a BAD thing, or haven’t they had much effect one way or the other?
Q23 Parents have different opinions about the impact of the internet on children today. Please tell me if you agree or disagree with each of the following statements…
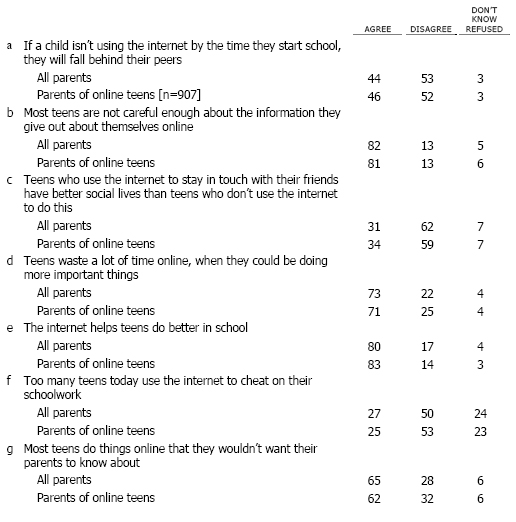
[N=1,100]
K3 Do you ever go online…3
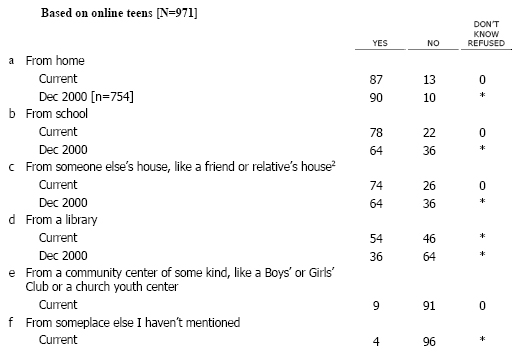
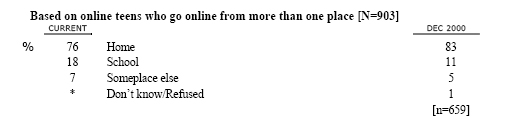
K4 Where do you go online MOST often?
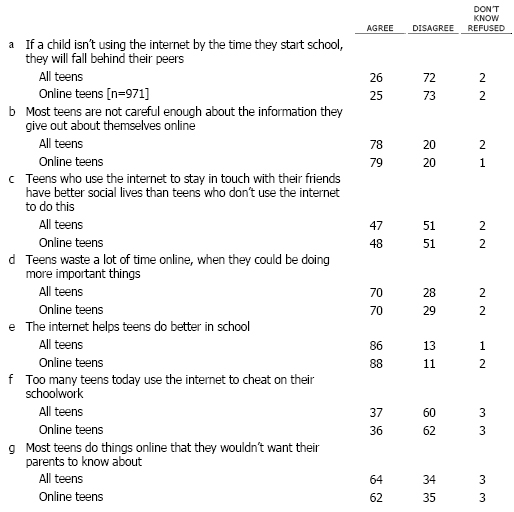
K7 People have different opinions about the impact of the internet on kids today. Please tell me if you agree or disagree with each of the following statements…
[N=736]
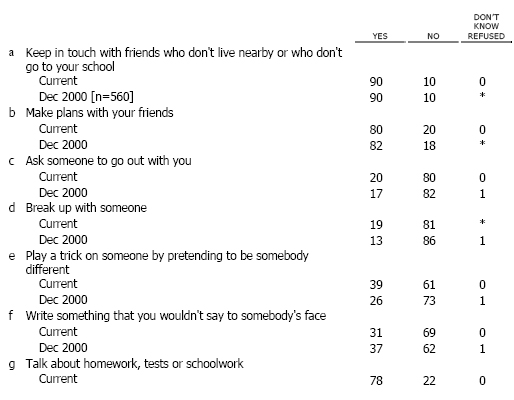
IM23 Not everyone uses instant messages the same way. What about you…? Have you ever used instant messages to…?
Methodology
Parents & Teens 2004
Prepared by Princeton Survey Research Associates International for the Pew Internet and American Life Project
November 2004
SUMMARY
The Parents & Teens 2004 Survey sponsored by the Pew Internet and American Life Project obtained telephone interviews with a nationally representative sample of 1,100 teens 12 to 17 years-old and their parents living in continental United States telephone households. The interviews were conducted in English by Princeton Data Source, LLC from October 26 to November 28, 2004. Statistical results are weighted to correct known demographic discrepancies. The margin of sampling error for the complete set of weighted data is ±3.3%.
Details on the design, execution and analysis of the survey are discussed below.
DESIGN AND DATA COLLECTION PROCEDURES
» Sample Design
The sample was designed to represent all teens ages 12 to 17 in continental U.S. telephone households. The sample is also representative of parents living with their teenage children.
The telephone sample was pulled from previous PIAL projects fielded in 2004 and 2003. Households with a child age 18 or younger were called back and screened to find 12 to 17 year-olds. The original telephone samples were provided by Survey Sampling International, LLC (SSI) according to PSRAI specifications. These samples were drawn using standard list-assisted random digit dialing (RDD) methodology.
» Contact Procedures
Interviews were conducted from October 26 to November 28, 2004. As many as 10 attempts were made to contact every sampled telephone number. Sample was released for interviewing in replicates, which are representative subsamples of the larger sample. Using replicates to control the release of sample ensures that complete call procedures are followed for the entire sample.
Calls were staggered over times of day and days of the week to maximize the chance of making contact with potential respondents. Each household received at least one daytime call in an attempt to find someone at home. In each contacted household, interviewers first determined if a child age 12 to 17 lived in the household. Households with no children of the proper age were deemed ineligible and screened out. In eligible households, interviewers first conducted a short interview with a parent or guardian. Then interviews were conducted with the target child.4
WEIGHTING AND ANALYSIS
Weighting is generally used in survey analysis to compensate for patterns of nonresponse that might bias results. The interviewed sample was weighted to match national parameters for both parent and child demographics. The parent demographics used for weighting were: sex; age; education; race; Hispanic origin; marital status and region (U.S. Census definitions). The child demographics used for weighting were gender and age. These parameters came from a special analysis of the Census Bureau’s 2003 Annual Social and Economic Supplement (ASEC) that included all households in the continental United States that had a telephone.
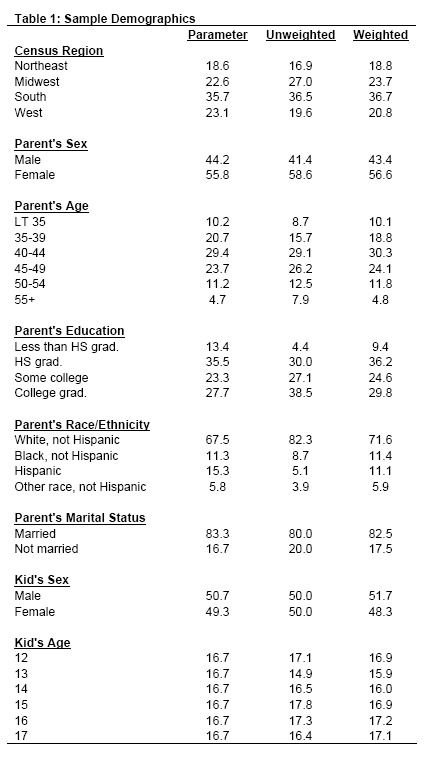
Weighting was accomplished using Sample Balancing, a special iterative sample weighting program that simultaneously balances the distributions of all variables using a statistical technique called the Deming Algorithm. Weights were trimmed to prevent individual interviews from having too much influence on the final results. The use of these weights in statistical analysis ensures that the demographic characteristics of the sample closely approximate the demographic characteristics of the national population. Table 1 compares weighted and unweighted sample distributions to population parameters.
Effects of Sample Design on Statistical Inference
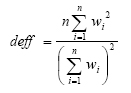
Post-data collection statistical adjustments require analysis procedures that reflect departures from simple random sampling. PSRAI calculates the effects of these design features so that an appropriate adjustment can be incorporated into tests of statistical significance when using these data. The so-called “design effect” or deff represents the loss in statistical efficiency that results from systematic non-response. The total sample design effect for this survey is 1.26.
PSRAI calculates the composite design effect for a sample of size n, with each case having a weight, wi as:
In a wide range of situations, the adjusted standard error of a statistic should be calculated by multiplying the usual formula by the square root of the design effect (√deff ). Thus, the formula for computing the 95% confidence interval around a percentage is:
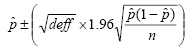
where pˆ is the sample estimate and n is the unweighted number of sample cases in the group being considered.
The survey’s margin of error is the largest 95% confidence interval for any estimated proportion based on the total sample— the one around 50%. For example, the margin of error for the entire sample is ±3.3%. This means that in 95 out every 100 samples drawn using the same methodology, estimated proportions based on the entire sample will be no more than 3.3 percentage points away from their true values in the population. It is important to remember that sampling fluctuations are only one possible source of error in a survey estimate. Other sources, such as respondent selection bias, questionnaire wording and reporting inaccuracy, may contribute additional error of greater or lesser magnitude.
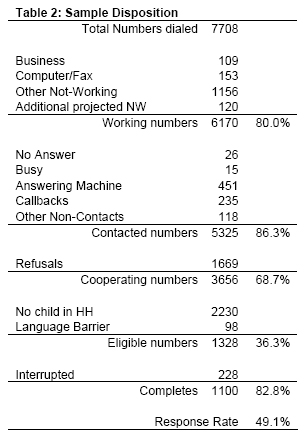
RESPONSE RATE
Table 2 reports the disposition of all sampled callback telephone numbers ever dialed. The response rate estimates the fraction of all eligible respondents in the sample that were ultimately interviewed. At PSRAI it is calculated by taking the product of three component rates:5
- Contact rate – the proportion of working numbers where a request for interview was made – of 86 percent6
- Cooperation rate – the proportion of contacted numbers where a consent for interview was at least initially obtained, versus those refused – of 69 percent
- Completion rate – the proportion of initially cooperating and eligible interviews that agreed to the child interview and were completed – of 83 percent
Thus the response rate for this survey was 49 percent.7