The average American internet user is not sure what podcasting is, what an RSS feed does, or what the term “phishing” means
Large numbers of internet users do not know the basic definition of some of the hottest new internet innovations and one of the most serious online dangers.
In a nationwide phone survey between May 4 and June 7, the Pew Internet & American Life Project asked internet users if they knew what certain internet terms meant. The results showed that some terms were well known, but that the terms “podcasting” and “RSS feeds” were not familiar to a majority of internet users and that “phishing” is still a foreign term to many:
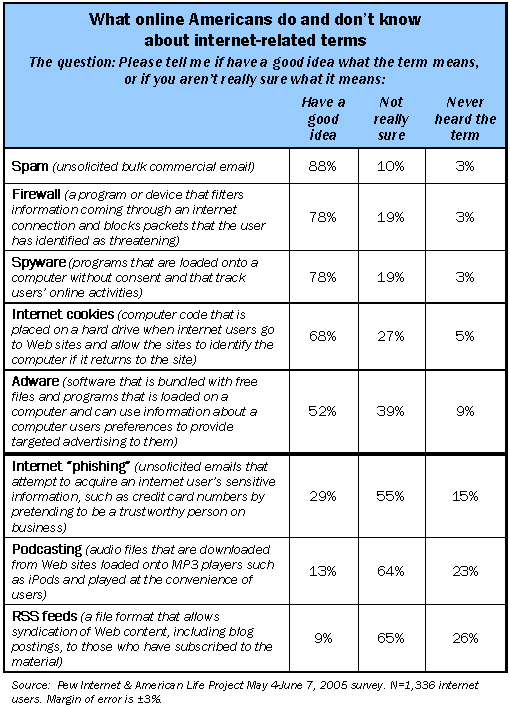
The findings are another reminder that new and exciting technology developments that seize the interest of industry officials and journalists such as podcasting and RSS feeds usually take a while to register in the wider public. In addition, it is also clear that public awareness of emerging online threats like those posed by phishing scams takes a while to emerge. A previous survey by the Pew Internet Project showed that 35% of email users had received phishing-type solicitations.1
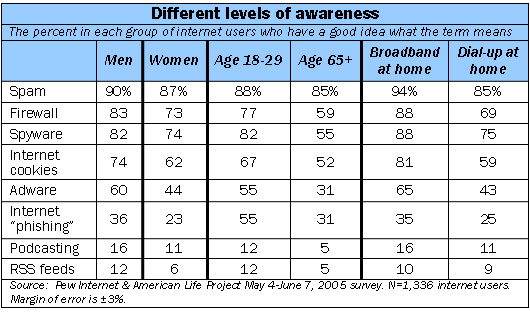
As a rule, online men are more likely than women to be aware of these terms. Those with college degrees are more aware than those with high school diplomas, and heavier internet users are more familiar with the lexicon than lighter users. Older internet users are less likely than younger ones to report a good grasp of these terms.
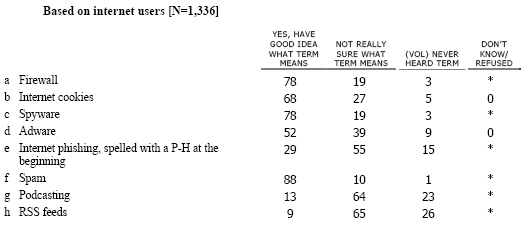
Q18 I’m going to read you some Internet terms you may or may not be familiar with. As I read each one, please tell me if you have a good idea what the term means, or if you aren’t really sure what it means.
Methodology
SUMMARY
The Spyware Survey, sponsored by the Pew Internet & American Life Project, obtained telephone interviews with a nationally representative sample of 2,001 adults living in continental United States telephone households. The survey was conducted by Princeton Survey Research International. Interviews were done in English by Princeton Data Source, LLC from May 4 to June 7, 2005. Statistical results are weighted to correct known demographic discrepancies. The margin of sampling error for the complete set of weighted data is ±2.3%.
Details on the design, execution and analysis of the survey are discussed below.
» Sample Design
The sample was designed to represent all continental U.S. telephone households. The telephone sample was provided by Survey Sampling International, LLC (SSI) according to PSRAI specifications. The sample was drawn using standard list-assisted random digit dialing (RDD) methodology. Active blocks of telephone numbers (area code + exchange + two-digit block number) that contained three or more residential directory listings were selected with probabilities in proportion to their share of listed telephone households; after selection two more digits were added randomly to complete the number. This method guarantees coverage of every assigned phone number regardless of whether that number is directory listed, purposely unlisted, or too new to be listed. After selection, the numbers were compared against business directories and matching numbers purged.
» Contact Procedures
Interviews were conducted from May 4 to June 7, 2005. As many as 10 attempts were made to contact every sampled telephone number. Sample was released for interviewing in replicates, which are representative subsamples of the larger sample. Using replicates to control the release of sample ensures that complete call procedures are followed for the entire sample.
Calls were staggered over times of day and days of the week to maximize the chance of making contact with potential respondents. Each household received at least one daytime call in an attempt to find someone at home. In each contacted household, interviewers asked to speak with the youngest adult male currently at home. If no male was available, interviewers asked to speak with either the youngest or oldest female at home based on a random rotation.2 This systematic respondent selection technique has been shown to produce samples that closely mirror the population in terms of age and gender.
WEIGHTING AND ANALYSIS
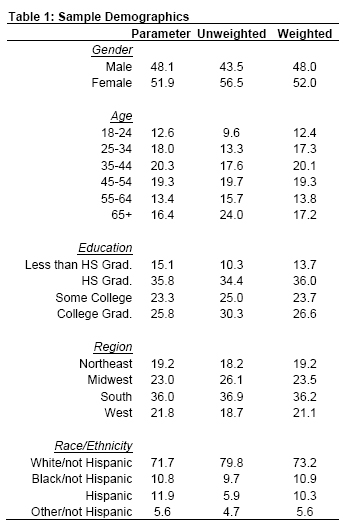
Weighting is generally used in survey analysis to compensate for patterns of nonresponse that might bias results. The interviewed sample of all adults was weighted to match national parameters for sex, age, education, race, Hispanic origin and region (U.S. Census definitions). These parameters came from a special analysis of the Census Bureau’s 2004 Annual Social and Economic Supplement (ASEC) that included all households in the continental United States that had a telephone.
Weighting was accomplished using Sample Balancing, a special iterative sample weighting program that simultaneously balances the distributions of all variables using a statistical technique called the Deming Algorithm. Weights were trimmed to prevent individual interviews from having too much influence on the final results. The use of these weights in statistical analysis ensures that the demographic characteristics of the sample closely approximate the demographic characteristics of the national population. Table 1 compares weighted and unweighted sample distributions to population parameters.
» Effects of Sample Design on Statistical Inference
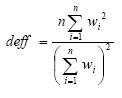
Post-data collection statistical adjustments require analysis procedures that reflect departures from simple random sampling. PSRAI calculates the effects of these design features so that an appropriate adjustment can be incorporated into tests of statistical significance when using these data. The so-called “design effect” or deff represents the loss in statistical efficiency that results from systematic non-response. The total sample design effect for this survey is 1.12.
PSRAI calculates the composite design effect for a sample of size n, with each case having a weight, wi as:
In a wide range of situations, the adjusted standard error of a statistic should be calculated by multiplying the usual formula by the square root of the design effect (√deff ). Thus, the formula for computing the 95% confidence interval around a percentage is:
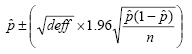
where pˆ is the sample estimate and n is the unweighted number of sample cases in the group being considered.
The survey’s margin of error is the largest 95% confidence interval for any estimated proportion based on the total sample— the one around 50%. For example, the margin of error for the entire sample is ±2.3%. This means that in 95 out every 100 samples drawn using the same methodology, estimated proportions based on the entire sample will be no more than 2.3 percentage points away from their true values in the population. It is important to remember that sampling fluctuations are only one possible source of error in a survey estimate. Other sources, such as respondent selection bias, questionnaire wording and reporting inaccuracy, may contribute additional error of greater or lesser magnitude.
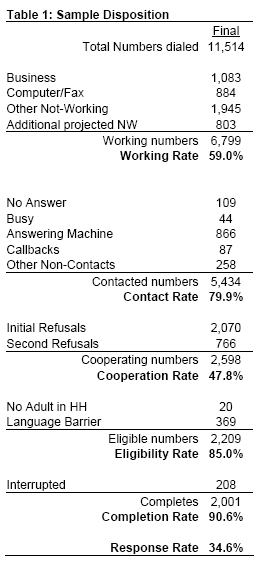
RESPONSE RATE
Table 2 reports the disposition of all sampled telephone numbers ever dialed from the original telephone number sample. The response rate estimates the fraction of all eligible respondents in the sample that were ultimately interviewed. At PSRAI it is calculated by taking the product of three component rates:3
- Contact rate – the proportion of working numbers where a request for interview was made – of 80 percent4
- Cooperation rate – the proportion of contacted numbers where a consent for interview was at least initially obtained, versus those refused – of 48 percent
- Completion rate – the proportion of initially cooperating and eligible interviews that were completed – of 91 percent
Thus the response rate for this survey was 35 percent.