Introduction
Policy makers have long hoped that the Internet could bring especially powerful benefits to rural areas, many of which have suffered economic problems as residents migrate to cities and suburbs. Many officials in small towns and rural regions hoped that technology that allowed people to communicate easily and cheaply with any modem owner in the world and to access all kinds of information, products and services on the Web would allow people to remain in rural settings while reaping some new social and economic rewards. Rural leaders and technology enthusiasts have dreamed that the Internet’s capacity to render physical location less meaningful would in some ways make rural life more desirable.
This report aims to provide a portrait of rural America’s Internet users, the activities they pursue online and their attitudes about the Internet compared to online Americans in urban and suburban communities.
Rural residents are less likely to be Internet users than those who live in suburbs or cities.
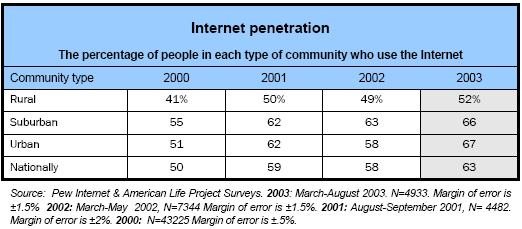
There are approximately 46 million adults living in rural communities, or 23% of the U.S. adult population, according to surveys in 2003 of the Pew Internet & American Life Project.5 In surveys taken between March and August last year, the Project found that 52% of rural adults use the Internet. That amounts to about 23 million people.
This marks notable growth in Internet use in rural regions, but the technology has not made the same headway into rural communities as it has in urban and suburban communities. Internet penetration rates in rural communities have increased about ten percentage points between 2000 and 2003. But while Internet penetration rates have increased in each community type, the gaps between these rates have remained relatively constant over time.
Just over half of rural Internet users go online at least once a day. By comparison, 64% of urban users and 64% of suburban users do so. Rural Internet users with three or more years experience are also less likely to go online than similarly experienced users in urban and suburban communities. About 59% of experienced rural users go online once or more daily, while 67% of experienced urban users do so and 66% of experienced suburban users do so. However, there is little difference between rural, urban, and suburban newcomers who go online daily. About 40% of urban newcomers go online daily, and 47% of suburban newcomers go online, while 44% of rural newcomers go online daily.
Remoteness and lower population density can be impediments to Internet deployment in rural areas.
One of the difficulties facing rural Internet deployment is geography. Sometimes terrain makes infrastructure building difficult, though a more common obstacle is cost. In 2000, the National Exchange Carriers Association estimated that the cost of upgrading the 3.3 million rural telephone lines that would not already be broadband capable by 2002 would cost $10.9 billion. Now, technologies such as DSL extenders and wireless connections suggest a lower price tag.6 Historically, networks of rail, road and telephone lines were first deployed in metropolitan areas. For commercial network services, metropolitan areas are more attractive places to build infrastructure because the large number of paying users on the network can overcome the initial costs of building it. Given these high costs and small returns, there is an economic disincentive for constructing networks in less populated areas. Not surprisingly then, rural communities’ Internet service providers are somewhat different than those of suburban communities and urban communities.
In rural communities, Internet service is provided by a number of different entities.
Internet service providers in rural areas are a diverse group. They include national and local telephone companies, national and local cable operators, telephone cooperatives, and municipal utilities. In October 2002, when asked to name their ISP, a large percentage of rural users (46%) named what appear to be small local providers. These responses were coded as “other,” which means their ISP does not appear in the list of ISPs appearing in Appendix A.7 In contrast to the 46% of rural users reporting “other”, 22% of suburban users’ ISPs fall into the category “other,” and 17% of urban users’ ISPs are not among those listed. With the exception of AOL and MSN, which combined account for about 20% of rural subscriptions, other large service providers such as Comcast, and Roadrunner each account for less than 3% of rural subscribers. In all, the providers listed in Appendix A account for about 40% of rural ISPs. In contrast, the providers listed provide service to 68% of urban communities and 69% of suburban communities. It is likely that for rural respondents, many of the ISPs contained in the “other” category are small cable and telephone companies, municipal operations, or cooperatives.
About 15% of users in urban communities and about 15% of users in rural communities did not know who their service provider was. In suburban areas, about 8% of users did not know.
Rural users say they sometimes have no choice when it comes to picking an ISP, but many rural users don’t think ISPs are much different from each other anyway.
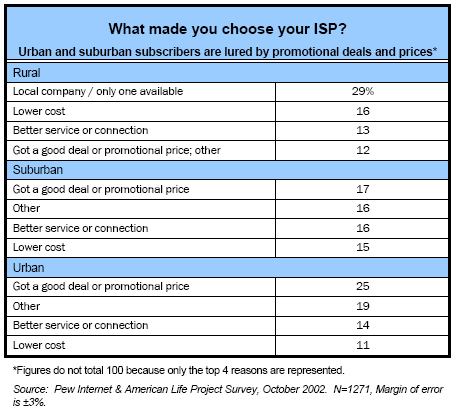
While different rural communities are served by different kinds of ISPs, within a rural community the option to choose between two or more providers is less common than in urban and suburban communities. According to data collected in October 2002, promotional offers guide urban and suburban users’ ISP choice, whereas rural users are guided by availability of a connection and then by how much it will cost.
Outside of rural communities, promotional offers are the top reason users chose their ISP. This is especially true in urban communities, where 25% of users say they chose their ISP because of a promotional offer or deal. The top reason rural users say they “chose” the provider they did is because it is the only one available to them. About 29% of rural users say the ISP to which they subscribe is the only one available to them. In contrast, 7% of urban users reported a single ISP, and about 9% of suburban users say there is but one ISP available to them. Rural dial-up users are slightly more likely than rural users as a whole to be served by a single provider. About 31% of rural dial-up users say their ISP is the only one available.
Rural communities can be more expensive to serve than more densely populated ones. These expenses have led some to contend that competition may be unsustainable in rural areas because of a smaller customer base.8 The data presented here relates to rural areas in general, not specific rural portions of the country. Because a rural community in, say, the Great Plains may differ substantially from a rural community outside of Atlanta, Georgia, decision-makers involved in the topic of ISP competition in rural areas may want to further pursue local differences between communities. While ISP competition is more prevalent in areas of higher population density, many rural users don’t see much difference between ISPs. Rural users are more likely than urban and suburban residents to feel that ISPs are all “pretty much the same.” Some 64% of rural residents say so, whereas about 50% of urban users and 52% of suburban residents say so.
Rural residents report a lower instance of high-speed availability to their homes than do urban and suburban residents.
Another way to observe deployment in rural communities is to examine high-speed, or broadband availability in each community type. In October 2002, the Pew Internet Project asked, Do you currently live in an area where you can subscribe to high-speed Internet service if you want to? Responses to this question do not measure actual physical facilities in each community type, but they indicate how many residents are aware of whether they have the option of broadband access. The table below shows that compared to their urban and suburban counterparts, a larger portion of each rural subgroup says a high-speed connection is unavailable to them.
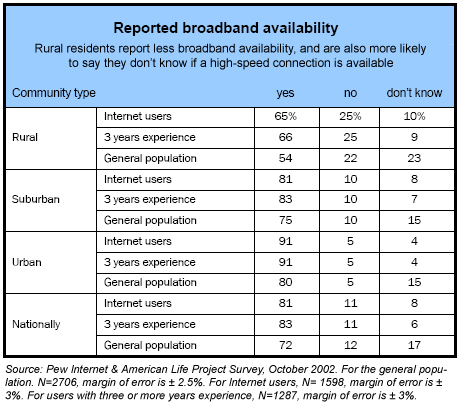
Rural residents are more likely than their urban and suburban counterparts to say that they don’t know if high-speed connection is available.
A number of respondents in each community type did not know whether or not high-speed access was available to their homes. Women are more likely than men to say that they do not know if a high-speed connection is available. Almost a quarter of the general rural population does not know if broadband has been deployed to their area. That compares to 15% of both the urban and suburban populations who say they do not know if broadband is available. The percentage of “don’t knows” drops noticeably when only Internet users, rather than the community populations in general, are asked about availability. For instance, about 10% of rural Internet users aren’t sure if a home high-speed connection is available, but nearly 25% of the rural population in general isn’t sure if a home high-speed connection is available. This difference might indicate that rural Internet users may be more “in the know” about broadband availability in their area than the rural population at large. On the other hand, this difference might indicate that rural users – especially those who have been online three years or more – live in areas where broadband is more likely to have been deployed. Regardless, even rural users who have been online three years or more are more likely than their suburban and urban counterparts to not know about broadband availability.
Dial-up is in decline, but a large percentage of rural users continue to use dial-up connections.
In 2000, the vast majority of Internet users in each community — upwards of 90% — used a dial-up connection to get online. In the following years, as broadband has become more common, the percentage of dial-up users has shrunk. Between 2000 and 2003, dial-up users shrank by 24% in suburban communities, and by 27% in urban communities. Rural areas also saw their dial-up contingent shrink, but more modestly, by 16%. The majority of rural users — 80%, or about 18 million people — use a dial-up connection, the country road of the Web.
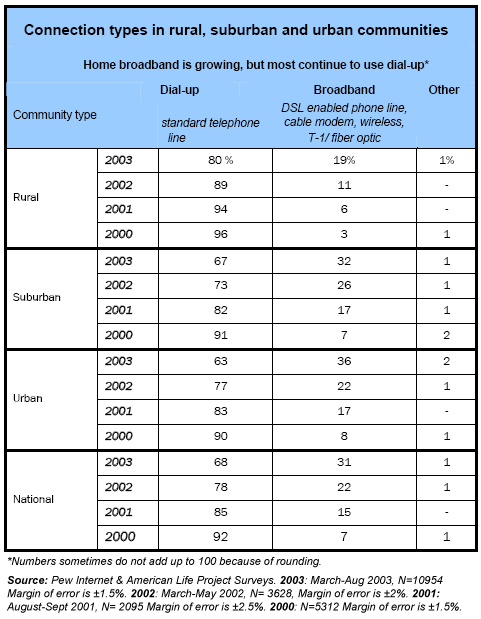
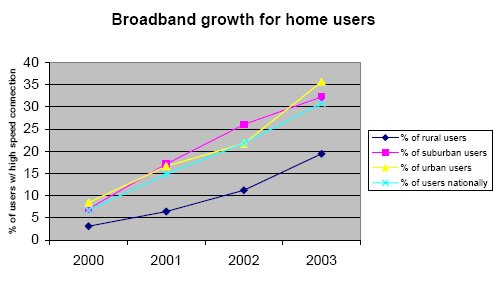
Over the past three years, broadband adoption has grown quickly in each community type, but rural Internet users are less likely than urban and suburban users to have a high-speed connection.
Over the past three years, broadband adoption has grown, especially in urban communities.9 In urban communities, about 8% of home Internet users had a broadband connection to their residence in 2000. That percentage has grown to 36% in 2003. Suburban broadband adoption has been slightly more modest, from 7% of home users in 2000 to 32% in 2003. The overall percentage of rural users with broadband is much lower. In 2000, about 3% of home users in rural areas had a broadband connection. Now, in 2003, about 19% have a high-speed connection. This 19% represents over 4 million people, or about 14% of the 31 million broadband users nationally. Still, rural broadband shows remarkable growth, with the percentage of rural users with a broadband connection nearly doubling each year.
One should keep in mind, however, that it is unclear where these rural broadband users are. “Rural” as defined above encompasses varied communities. Rural communities vary in terms of their remoteness, their economies, and whether or not they are growing or shrinking in population, among other factors. Some rural communities may lie outside an urban center making broadband deployment to those areas more cost-efficient than in more remote communities. In addition, rural communities closer to urban areas may also have greater demand for broadband services.
Satellite and wireless connections hold the promise to serve more remote areas, and in 2003 the Department of Agriculture and the Federal Communications Commission launched a joint initiative to stimulate wireless broadband adoption in rural communities. However, the number of wireless users is presently too small to assess the growth of wireless connections.
Rural dial-up users are equally as likely as urban and suburban dial-up users to want a broadband connection.
In terms of demand for high-speed connections, rural users are no different than urban and suburban users. Like their urban and suburban counterparts, about 38% of rural users say they would like to have a high-speed connection, while about 62% say they would not. In 2003, the National Telecommunications Cooperative Association, a group representing 560 (mostly rural) telephone cooperatives and small telephone companies, surveyed its members about broadband availability.10 The NTCA found that virtually all (97%) of the 200+ companies and cooperatives responding offered broadband service to some part of their service area. This “some part” was, on average, to about 70% of a provider’s customers. However, only 7% of residential customers subscribed to the service, and 9% of business customers did. This low adoption rate may be because voice customers are getting high-speed Internet services from a cable or wireless competitor. However, the NTCA did find that the broadband offerings of 44% of the companies responding to the survey faced no competition. These findings, like those of the Pew Internet Project, suggest that demand for broadband connections is not uniformly outstripping availability of broadband connections in all rural communities.
The cost of deployment remains a barrier to rural residents’ access, and according to Pew Internet Project numbers, access remains an issue. Nevertheless, according to the NTCA, many local telephone companies and cooperatives are already offering broadband connections. In sum, there is at times a lack of demand for high-speed services in rural areas, even when connections are available.
Rural users are more likely than urban and suburban users to go online from a third location – some place other than home or work.
According to data collected by the Pew Internet Project in October 2002, 22% of Internet users say they go online from a place that is neither home nor work. Many of them, of course, go online from home and from work in addition to going online from another locale like libraries, hotels, cybercafés, or friends’ homes. However, a relatively high proportion of rural Internet users depend on gaining access to the Internet from those other places because they do not have access at home or work. Data collected from March through August of 2003 reveals that some 8% of rural users — nearly 2 million people — go online exclusively from a place other than home or work — for instance from libraries, friends’ homes, or schools. This figure is more than double that of suburban communities, where about 3% of adult users go online only from a location or from locations other than home or work.
Who uses these third locations and why? Those who rely on third locations seem to be young adults who lack the resources to get online at home or work. Compared to home users and work users, third location users also tend to have relatively little online experience. They are very unlikely to go online daily, and 41% of those who depend on third locations for their access have less than three years of experience online. In comparison, 17% of home-only users have fewer than three years of experience, and 18% of work-only users do. Third locations therefore appear to be places to get online at little or no cost, as well as places for newcomers to learn and become familiar with the Internet.


