This Pew Internet & American Life Project report is based on the findings of daily tracking surveys on Americans’ use of the Internet.
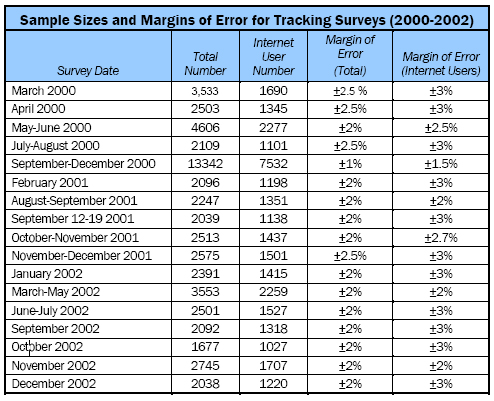
The primary numerical data used for this report was gathered through telephone interviews conducted by Princeton Survey Research Associates between March 2000 and December 2002 among multiple samples of adults, aged 18 and older. Please see the chart below for detailed information on sample size and margins of error for each survey period. Additional data is cited from an August 2003 survey also gathered through telephone interviews conducted by Princeton Survey Research Associates. For results based on the total sample from August 2003 (n=2,925), one can say with 95% confidence that the error attributable to sampling and other random effects is plus or minus two percentage points. For results based on Internet users (n=1,899), the margin of sampling error is also plus or minus two percentage points. In addition to sampling error, question wording and practical difficulties in conducting telephone surveys may introduce some error or bias into the findings of opinion polls.
Additional data from 2003, also gathered through telephone interviews conducted by Princeton Survey Research Associates, is cited throughout the report. These surveys were conducted between March and August 2003. For results based on the total sample from March 12-19, 2003 (n=883), one can say with 95% confidence that the error attributable to sampling and other random effects is plus or minus four percentage points. For results based on Internet users (n=510), the margin of sampling error is plus or minus five percentage points. For results based on the total merged sample from March 12-19 and April 29-May 20, 2003 (n=2515), one can say with 95% confidence that the error attributable to sampling and other random effects is plus or minus three percentage points. For results based on Internet users (n=1,555), the margin of sampling error is also plus or minus three percentage points. For results based on the total sample from June 10-24, 2003 (n=2,200), one can say with 95% confidence that the error attributable to sampling and other random effects is plus or minus two percentage points. For results based on Internet users (n=1,380), the margin of sampling error is plus or minus three percentage points. For results based on the total sample from August 2003 (n=2,925), one can say with 95% confidence that the error attributable to sampling and other random effects is plus or minus two percentage points. For results based on Internet users (n=1,899), the margin of sampling error is also plus or minus two percentage points. In addition to sampling error, question wording and practical difficulties in conducting telephone surveys may introduce some error or bias into the findings of opinion polls.
The sample for each survey is a random digit sample of telephone numbers selected from telephone exchanges in the continental United States. The random digit aspect of the sample is used to avoid “listing” bias and provides representation of both listed and unlisted numbers (including not-yet-listed numbers). The design of the sample achieves this representation by random generation of the last two digits of telephone numbers selected on the basis of their area code, telephone exchange, and bank number.
New sample was released daily and was kept in the field for at least 5 days. This ensures that complete call procedures were followed for the entire sample. Additionally, the sample was released in replicates to make sure that the telephone numbers called are distributed appropriately across regions of the country. At least 10 attempts were made to complete an interview at every household in the sample. The calls were staggered over times of day and days of the week to maximize the chances of making contact with a potential respondent. Interview refusals were re-contacted at least once in order to try again to complete an interview. All interviews completed on any given day were considered to be the final sample for that day.
Non-response in telephone interviews produces some known biases in survey-derived estimates because participation tends to vary for different subgroups of the population, and these subgroups are likely to vary also on questions of substantive interest. In order to compensate for these known biases, the sample data are weighted in analysis. The demographic weighting parameters are derived from a special analysis of the most recently available Census Bureau’s Current Population Survey. This analysis produces population parameters for the demographic characteristics of adults age 18 or older, living in households that contain a telephone. These parameters are then compared with the sample characteristics to construct sample weights. The weights are derived using an iterative technique that simultaneously balances the distribution of all weighting parameters.
Throughout the report, survey results are used to estimate the approximate number of American adults, in millions, who were engaging in Internet activities during a particular period. These figures are derived from the Census Bureau’s estimates of the number of adults living in telephone households in the continental United States. The Census Bureau updates these estimates at the end of each year. The schedule of estimates that were used in this report to calculate the number of people doing any given activity online was as follows: 188 million American adults was used as the baseline for estimates from our March 2000-December 2000 surveys, 191 million for February 2001-December 2001 surveys, 193 million for January 2002-December 2002 surveys, and 200 million for March 2003 to the present. In some cases, the approximated number of people doing an activity may differ from previously published estimates due to the timing of the Census Bureau’s releases.
Each sample is weighted to be representative of the whole population. It is frequently the case, though, that the samples are not large enough to involve large numbers of people in certain subpopulations. Therefore, any reference to a subgroup with a sample size of less than 100 was footnoted accordingly in this report.


